 Metadata catalogue
2025
Type of resources
Available actions
Topics
INSPIRE themes
Keywords
Contact for the resource
Provided by
Years
Formats
Representation types
Update frequencies
status
Service types
Scale
Resolution
-
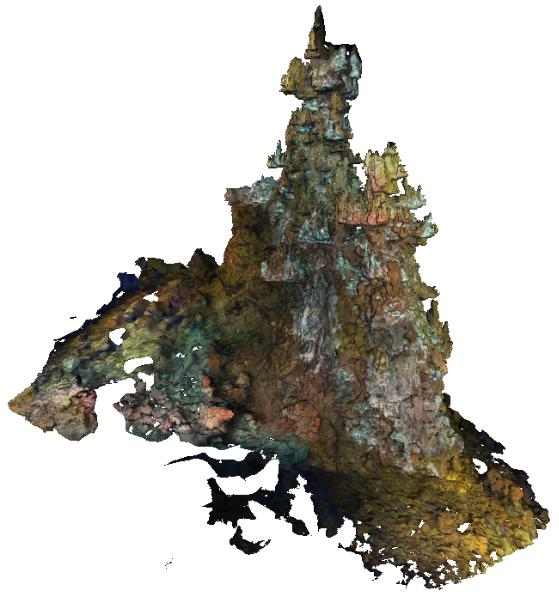
The Capelinhos hydrothermal vent site is a large edifice of 588 m² from its base. Located off axis, 1.5 km east of the central lava lake of the main Lucky Strike Hydrothermal Vent Field (mLSHVF), it is characterised by distinct geochemical and thermal conditions from the others mLSHVF edifices, with notably high iron concentrations compared to sites around the lava lake. The edifice has been surveyed with the remotely operated vehicle Victor6000 for inter-annual monitoring during the 2023 Momarsat cruise. Video transects were collected during dive 844-6 with a forward-looking camera and video sequences were used to build 3D models of the edifice using structure-from-motion techniques. A first dataset includes 2971 images extracted every 2 seconds from the videos. The images are time-stamped and linked to a navigation file, which is generated by interpolating navigation data at the corresponding timestamps. A second dataset includes a 3D textured model of the site (obj format) together with the a kml file for georeferencing. The ROV navigation file (.txt) is provided separately. Point : 37.28948183 (lat) -32.26413676 (long) -1663.487 (depth)
-

The Sintra hydrothermal vent site reconstructed in this dataset is 311.82 m². It is located in the North east of the main Lucky Strike Hydrothermal Vent Field (LSHF). The edifice has been surveyed with the remotely operated vehicle Victor6000 for inter-annual monitoring during the 2023 Momarsat cruise. Video transects were collected during dive 844-6 with a forward-looking camera and video sequences were used to build a 3D model of the edifice using structure-from-motion techniques. A first dataset includes 1561 images extracted every 2 seconds from the videos. The images are time-stamped and linked to a navigation file, which is generated by interpolating navigation data at the corresponding timestamps. A second dataset includes a 3D textured model of the site (obj format) together with the a kml file for georeferencing. The ROV navigation file (.txt) is provided separately. Point : 37.2921244612 (lat) -32.2750499167 (long) -1612.34 (depth)
-
Ages obtained through the 40Ar/39Ar method for basalt samples with the Nautile submersible along the axis of the Mid-Atlantic Ridge south of the Romanche transform fault. Major elements measurements were performed on the same samples. For a complete description of the method and discussion of results, please refer to the Grenet et al. 2023 article.
-
Processed high resolution bathymetry acquired during the SERPENTINE, 2007 cruise of RV Pourquoi Pas?

High-resolution bathymetry data were acquired over three areas of the Mid-Atlantic Ridge, during three dives of ROV Victor 6000 SERPENTINE cruise onboard RV Pourquoi Pas?, using a RESON 7125 echosounder mounted on the ROV frame, with an operating frequencyof 400 kHz, a beam opening angle of 120°, a velocity of ~0.3 m/s, maintaining an altitude ~50 m above the seafloor and using ultra-short baseline ROV positioning. Data processing was conducted with the Caraibes 5.0 software (@Ifremer). The processed grids have a grid spacing of 0.5 m (Krasnov area), or 1m (Logatchev and Ashadze areas).
-
Gridded shipboard multibeam bathymetry and backscatter mosaics along the axis of the Mid-Atlantic Ridge. The used data are part of the dataset acquired during the SMARTIES cruise (2019). The gridded datasets cover different portions of the axis of the Mid-Atlantic Ridge south of the Romanche transform fault. Bathymetry grids format: nf = GMT netCDF format (32-bit float), CF-1.7 area NTD1_W grid information: x_min: -16.8647 x_max: -16.716917313 x_inc: 0.000180003272838 name: x n_columns: 822 y_min: -0.0246146868 y_max: 0.0418 y_inc: 0.000179985601084 name: y n_rows: 370 area NTD1_E grid information: x_min: -16.6878 x_max: -16.6098585829 x_inc: 0.000180003272748 name: x n_columns: 434 y_min: -0.0313156947 y_max: 0.0225 y_inc: 0.000179985601003 name: y n_rows: 300 area RC2 grid information: x_min: -16.5302 x_max: -16.3748571756 x_inc: 0.000180003272769 name: x n_columns: 864 y_min: -0.2029041037 y_max: -0.0042 y_inc: 0.000179985601178 name: y n_rows: 1105 area NTD2 grid information: x_min: -16.29 x_max: -16.183078056 x_inc: 0.000180003272727 name: x n_columns: 595 y_min: -0.2707547876 y_max: -0.2056 y_inc: 0.000179985601105 name: y n_rows: 363 area RC3 grid information: x_min: -16.1522 x_max: -16.065078416 x_inc: 0.000180003272727 name: x n_columns: 485 y_min: -0.3490268035 y_max: -0.30907 y_inc: 0.000179985601351 name: y n_rows: 223
-
The following data were acquired in 2013 by the french research vessel N/O Suroit during the CIRCEE cruise (see the cruise report): - High-resolution 72-trace seismic data. The files are available in the segy format. A map is provided to locate the 1500 km of seismic profile acquired. - Gridded bathymetry data (resolution : 90m) available in GRD format (software GMT Generic Mapping Software de Wessel & Smith based on NetCDF libraries). A map is available. - Bathymetry data from multibeam echo sounder Kongsberg-Simrad EM302. The data are available in the raw data mbg and include the travel time and amplitude (reflectivity). - Highfrequency chirp-sonar data. The files are available in the segy format. A map is available in the cruise report.
-
The precise location and geometry of oceanic spreading centers and associated transform faults or discontinuities' boundary has fundamental implications in our understanding of oceanic accretion, the accommodation of deformation around rigid lithospheric blocks, and the distribution of magmatic and volcanic processes. The now widely used location of mid oceanic ridges worldwide, published by P. Bird in 2003, can be updated based on recent publicly available and published ship-based multibeam swath bathymetry data (100-m resolution or better), now available to ~25% of the ocean seafloor, but covering a significant proportion of the mid-ocean ridge system (>70%). Here we publish the MAPRIDGES database built under the coordination of CGMW (Commission for the Geological Map of the World), with a first version V1.0 (06/2024) that provides high resolution and up-to-date datasets of mid-ocean ridge segments and associated transform faults, and follow-up updates that will also include non-transform offsets. The detailed mapping of individual mid oceanic ridge segments was conducted using GMRT (Ryan et al., 2009) (version 4.2 for MAPRIDGES V1.0), other publicly available datasets (e.g., NCEI, Pangaea, AWI), and existing literature. MAPRIDGES will be revised with the acquisition of additional datasets, new publications, and correction of any errors in the database. The MAPRIDGE database was built in a GIS environment, where each feature holds several attributes specific to the dataset. We include three different georeferenced shapefile layers: 1) Ridge Segments, 2) Transform Faults, and 3) Transform Zones. The latest corresponds to zones of distributed strike-slip deformation that lack a well-defined fault localizing strain, but that are often treated as transform faults. 1) The Ridge Segments Layer contains 1461 segments with 9 attributes: - AREA_LOCA: The Name of the Ridge System - LOC_SHORT: The short form of the Ridge System using 3 characters - LAT: The maximum latitude of the ridge segment - LONG: the maximum longitude of the ridge segment - LENGTH: the length of the ridge segment in meters - CONFIDENCE: the degree of confidence on digitization based on the availability of high-resolution bathymetry data: 1 = low to medium confidence, 2 = high confidence - REFERENCES: supporting references used for the digitization - NAME_CODE: unique segment code constructed from the LOC_SHORT and LAT attributes in degree, minute, second coordinate format - NAME_LIT: name of the segment from the literature if it exists 2) The Transform Fault Layer contains 260 segments with 4 attributes: - NAME_TF: Name of the transform fault according to the literature - LENGTH: length of the transform fault in meters - LAT: The maximum latitude of the fault segment - LONG: the maximum longitude of the fault segment 3) The Transform Zone layer contains 10 segments with 4 attributes: - NAME_TF: Name of the transform zone according to the literature - LENGTH: length of the transform fault in meters - LAT: The maximum latitude of the fault segment - LONG: the maximum longitude of the fault segment To facilitate revisions and updates of the database, relevant information, corrections, or data could be sent to B. Sautter (benjamin.sautter@univ-ubs.fr) and J. Escartín (escartin@geologie.ens.fr).
-
AUV photomosaics of the seafloor at the shallow-water Milos hydrothermal system. Photomosaics were acquired with the Sparus II (Iqua, Girona) AUV and constructed from vertically acquired still images. Images were acquired in July 2019 at the Paleochori and Spathi Bays. Photomosaics are provided as geotiffs (UTM Zone 35). This dataset includes both original photomosaics, that show distortions due to AUV navigation drift, and georeferenced photomosaics, that have been registered with the associated drone photomosaics at these same areas.
-
Multibeam bathymetry data, gridded at ~100m, acquired around during the transit towards the Mid-Atlantic ridge axis (13°20'N and 13°30'N oceanic detachments area) during the ODEMAR cruise (2013). Bathymetric data was acquired by the PourQUoi Pas? multibeam system (RESON SEABAT 7150). Data is provided as geotiffs (WGS84) ODM_transit_16Nov.tif Extent -27.8375538800000015,16.3530121699999995 : -26.3755538800000018,16.6860121699999979 Width 1463 Height 334 Data type Float32 - Thirty two bit floating point GDAL Driver Description GTiff GDAL Driver Metadata GeoTIFF Dataset Description /Users/jescartin/WORK/Proyectos/ODEMAR/DATA/Bathygrids/Transit/ODM_transit_16Nov.tif Compression PACKBITS Band 1 STATISTICS_MAXIMUM=-4139.5639648438 STATISTICS_MEAN=-4612.4823849892 STATISTICS_MINIMUM=-4866.7373046875 STATISTICS_STDDEV=121.40234041923 STATISTICS_VALID_PERCENT=29.85 Scale: 1 Offset: 0 More information AREA_OR_POINT=Area TIFFTAG_SOFTWARE=MATLAB 9.14, Mapping Toolbox 5.5 Dimensions X: 1463 Y: 334 Bands: 1 Origin -27.8375538800000015,16.6860121699999979 Pixel Size 0.0009993164730006834189,-0.0009970059880239474058 ODM_transit_17Nov.tif Extent -32.4955601099999996,15.5934151199999995 : -27.8195601099999976,16.4454151199999998 Width 4677 Height 853 Data type Float32 - Thirty two bit floating point GDAL Driver Description GTiff GDAL Driver Metadata GeoTIFF Dataset Description /Users/jescartin/WORK/Proyectos/ODEMAR/DATA/Bathygrids/Transit/ODM_transit_17Nov.tif Compression PACKBITS Band 1 STATISTICS_APPROXIMATE=YES STATISTICS_MAXIMUM=-4458.8168945312 STATISTICS_MEAN=-5144.8000932272 STATISTICS_MINIMUM=-5562.1850585938 STATISTICS_STDDEV=164.55246561258 STATISTICS_VALID_PERCENT=50.04 Scale: 1 Offset: 0 More information AREA_OR_POINT=Area TIFFTAG_SOFTWARE=MATLAB 9.14, Mapping Toolbox 5.5 Dimensions X: 4677 Y: 853 Bands: 1 Origin -32.4955601099999996,16.4454151199999998 Pixel Size 0.0009997861877271759391,-0.0009988276670574447458 ODM_transit_18Nov.tif Extent -36.9279732571747630,14.8264479347363469 : -32.4729732571747647,15.7054479347363465 Width 4456 Height 880 Data type Float32 - Thirty two bit floating point GDAL Driver Description GTiff GDAL Driver Metadata GeoTIFF Dataset Description /Users/jescartin/WORK/Proyectos/ODEMAR/DATA/Bathygrids/Transit/ODM_transit_18Nov.tif Compression PACKBITS Band 1 STATISTICS_APPROXIMATE=YES STATISTICS_MAXIMUM=-5171.58203125 STATISTICS_MEAN=-5712.1738558372 STATISTICS_MINIMUM=-5946.1611328125 STATISTICS_STDDEV=139.45706418798 STATISTICS_VALID_PERCENT=7.565 Scale: 1 Offset: 0 More information AREA_OR_POINT=Area TIFFTAG_SOFTWARE=MATLAB 9.14, Mapping Toolbox 5.5 Dimensions X: 4456 Y: 880 Bands: 1 Origin -36.9279732571747630,15.7054479347363465 Pixel Size 0.0009997755834829438748,-0.0009988636363636358394 ODM_transit_19Nov.tif Extent -41.3188024399999989,14.0843680599999992 : -36.8828024399999990,14.9493680599999994 Width 4437 Height 866 Data type Float32 - Thirty two bit floating point GDAL Driver Description GTiff GDAL Driver Metadata GeoTIFF Dataset Description /Users/jescartin/WORK/Proyectos/ODEMAR/DATA/Bathygrids/Transit/ODM_transit_19Nov.tif Compression PACKBITS Band 1 STATISTICS_APPROXIMATE=YES STATISTICS_MAXIMUM=-4540.5317382812 STATISTICS_MEAN=-5176.2961468757 STATISTICS_MINIMUM=-5426.123046875 STATISTICS_STDDEV=183.14492125461 STATISTICS_VALID_PERCENT=7.674 Scale: 1 Offset: 0 More information AREA_OR_POINT=Area TIFFTAG_SOFTWARE=MATLAB 9.14, Mapping Toolbox 5.5 Dimensions X: 4437 Y: 866 Bands: 1 Origin -41.3188024399999989,14.9493680599999994 Pixel Size 0.0009997746224926751767,-0.0009988452655889147342 ODM_transit_20Nov.tif Extent -44.9630377200000027,13.5018919999999998 : -41.3030377200000061,14.1828919999999989 Width 3661 Height 682 Data type Float32 - Thirty two bit floating point GDAL Driver Description GTiff GDAL Driver Metadata GeoTIFF Dataset Description /Users/jescartin/WORK/Proyectos/ODEMAR/DATA/Bathygrids/Transit/ODM_transit_20Nov.tif Compression PACKBITS Band 1 STATISTICS_APPROXIMATE=YES STATISTICS_MAXIMUM=-3173.7924804688 STATISTICS_MEAN=-4347.3027374804 STATISTICS_MINIMUM=-4821.65625 STATISTICS_STDDEV=276.6463937856 STATISTICS_VALID_PERCENT=42.31 Scale: 1 Offset: 0 More information AREA_OR_POINT=Area TIFFTAG_SOFTWARE=MATLAB 9.14, Mapping Toolbox 5.5 Dimensions X: 3661 Y: 682 Bands: 1 Origin -44.9630377200000027,14.1828919999999989 Pixel Size 0.0009997268505872703662,-0.000998533724340174662
-
Seismic profile ST5-014 was acquired in May 2015 during the STEP 2015 cruise (DOI:10.17600/15006100) on the continental shelf offshore Nice Airport (SE France). The source was a 1200 J Sparker from Geo Marine Survey with electrical pulse on a 400 tip electrode. The seismic data were recorded on a Geo-sense 48-channel streamer of 230 m long with a trace spacing of 3.125 m which was towed at a depth of 0.6 m. One Automatic Identification System was deployed on the seismic source and two others on the head and tail of the streamer to ensure positioning with meter accuracy. The pre-processing of the seismic data included common midpoint binning, spherical divergence correction, 125-2500 Hz bandpass filtering, normal moveout correction and signature deconvolution. To preserve the high frequency content of the source only the first 24 traces were stacked (i.e. maximum offset of 80 m). This provided seismic data with a frequency range of 175 to 850 Hz. Detailed Root Mean Square velocity analyses were performed on super gathers every 1 m. After the picking of velocities on semblance panels, interval velocities were computed using the Dix equation. Stack and post-stack time migration were then applied using this velocity field. The time-migrated seismic data were converted to standard SEG-Y rev1 format (https://seg.org/Portals/0/SEG/News%20and%20Resources/Technical%20Standards/seg_y_rev1.pdf) with values written using “big-endian” byte ordering and IEEE floating-point. Seismic coordinates in trace headers are in WGS84 format and +DDDMMSS.ss unit (with a scale factor of -100).