 Metadata catalogue
GEOTIFF
Type of resources
Available actions
Topics
INSPIRE themes
Keywords
Contact for the resource
Provided by
Years
Formats
Representation types
Update frequencies
status
Service types
Scale
Resolution
-
Processed high resolution bathymetry acquired during the SERPENTINE, 2007 cruise of RV Pourquoi Pas?

High-resolution bathymetry data were acquired over three areas of the Mid-Atlantic Ridge, during three dives of ROV Victor 6000 SERPENTINE cruise onboard RV Pourquoi Pas?, using a RESON 7125 echosounder mounted on the ROV frame, with an operating frequencyof 400 kHz, a beam opening angle of 120°, a velocity of ~0.3 m/s, maintaining an altitude ~50 m above the seafloor and using ultra-short baseline ROV positioning. Data processing was conducted with the Caraibes 5.0 software (@Ifremer). The processed grids have a grid spacing of 0.5 m (Krasnov area), or 1m (Logatchev and Ashadze areas).
-
Multibeam bathymetry data, gridded at ~100m, acquired around during the transit towards the Mid-Atlantic ridge axis (13°20'N and 13°30'N oceanic detachments area) during the ODEMAR cruise (2013). Bathymetric data was acquired by the PourQUoi Pas? multibeam system (RESON SEABAT 7150). Data is provided as geotiffs (WGS84) ODM_transit_16Nov.tif Extent -27.8375538800000015,16.3530121699999995 : -26.3755538800000018,16.6860121699999979 Width 1463 Height 334 Data type Float32 - Thirty two bit floating point GDAL Driver Description GTiff GDAL Driver Metadata GeoTIFF Dataset Description /Users/jescartin/WORK/Proyectos/ODEMAR/DATA/Bathygrids/Transit/ODM_transit_16Nov.tif Compression PACKBITS Band 1 STATISTICS_MAXIMUM=-4139.5639648438 STATISTICS_MEAN=-4612.4823849892 STATISTICS_MINIMUM=-4866.7373046875 STATISTICS_STDDEV=121.40234041923 STATISTICS_VALID_PERCENT=29.85 Scale: 1 Offset: 0 More information AREA_OR_POINT=Area TIFFTAG_SOFTWARE=MATLAB 9.14, Mapping Toolbox 5.5 Dimensions X: 1463 Y: 334 Bands: 1 Origin -27.8375538800000015,16.6860121699999979 Pixel Size 0.0009993164730006834189,-0.0009970059880239474058 ODM_transit_17Nov.tif Extent -32.4955601099999996,15.5934151199999995 : -27.8195601099999976,16.4454151199999998 Width 4677 Height 853 Data type Float32 - Thirty two bit floating point GDAL Driver Description GTiff GDAL Driver Metadata GeoTIFF Dataset Description /Users/jescartin/WORK/Proyectos/ODEMAR/DATA/Bathygrids/Transit/ODM_transit_17Nov.tif Compression PACKBITS Band 1 STATISTICS_APPROXIMATE=YES STATISTICS_MAXIMUM=-4458.8168945312 STATISTICS_MEAN=-5144.8000932272 STATISTICS_MINIMUM=-5562.1850585938 STATISTICS_STDDEV=164.55246561258 STATISTICS_VALID_PERCENT=50.04 Scale: 1 Offset: 0 More information AREA_OR_POINT=Area TIFFTAG_SOFTWARE=MATLAB 9.14, Mapping Toolbox 5.5 Dimensions X: 4677 Y: 853 Bands: 1 Origin -32.4955601099999996,16.4454151199999998 Pixel Size 0.0009997861877271759391,-0.0009988276670574447458 ODM_transit_18Nov.tif Extent -36.9279732571747630,14.8264479347363469 : -32.4729732571747647,15.7054479347363465 Width 4456 Height 880 Data type Float32 - Thirty two bit floating point GDAL Driver Description GTiff GDAL Driver Metadata GeoTIFF Dataset Description /Users/jescartin/WORK/Proyectos/ODEMAR/DATA/Bathygrids/Transit/ODM_transit_18Nov.tif Compression PACKBITS Band 1 STATISTICS_APPROXIMATE=YES STATISTICS_MAXIMUM=-5171.58203125 STATISTICS_MEAN=-5712.1738558372 STATISTICS_MINIMUM=-5946.1611328125 STATISTICS_STDDEV=139.45706418798 STATISTICS_VALID_PERCENT=7.565 Scale: 1 Offset: 0 More information AREA_OR_POINT=Area TIFFTAG_SOFTWARE=MATLAB 9.14, Mapping Toolbox 5.5 Dimensions X: 4456 Y: 880 Bands: 1 Origin -36.9279732571747630,15.7054479347363465 Pixel Size 0.0009997755834829438748,-0.0009988636363636358394 ODM_transit_19Nov.tif Extent -41.3188024399999989,14.0843680599999992 : -36.8828024399999990,14.9493680599999994 Width 4437 Height 866 Data type Float32 - Thirty two bit floating point GDAL Driver Description GTiff GDAL Driver Metadata GeoTIFF Dataset Description /Users/jescartin/WORK/Proyectos/ODEMAR/DATA/Bathygrids/Transit/ODM_transit_19Nov.tif Compression PACKBITS Band 1 STATISTICS_APPROXIMATE=YES STATISTICS_MAXIMUM=-4540.5317382812 STATISTICS_MEAN=-5176.2961468757 STATISTICS_MINIMUM=-5426.123046875 STATISTICS_STDDEV=183.14492125461 STATISTICS_VALID_PERCENT=7.674 Scale: 1 Offset: 0 More information AREA_OR_POINT=Area TIFFTAG_SOFTWARE=MATLAB 9.14, Mapping Toolbox 5.5 Dimensions X: 4437 Y: 866 Bands: 1 Origin -41.3188024399999989,14.9493680599999994 Pixel Size 0.0009997746224926751767,-0.0009988452655889147342 ODM_transit_20Nov.tif Extent -44.9630377200000027,13.5018919999999998 : -41.3030377200000061,14.1828919999999989 Width 3661 Height 682 Data type Float32 - Thirty two bit floating point GDAL Driver Description GTiff GDAL Driver Metadata GeoTIFF Dataset Description /Users/jescartin/WORK/Proyectos/ODEMAR/DATA/Bathygrids/Transit/ODM_transit_20Nov.tif Compression PACKBITS Band 1 STATISTICS_APPROXIMATE=YES STATISTICS_MAXIMUM=-3173.7924804688 STATISTICS_MEAN=-4347.3027374804 STATISTICS_MINIMUM=-4821.65625 STATISTICS_STDDEV=276.6463937856 STATISTICS_VALID_PERCENT=42.31 Scale: 1 Offset: 0 More information AREA_OR_POINT=Area TIFFTAG_SOFTWARE=MATLAB 9.14, Mapping Toolbox 5.5 Dimensions X: 3661 Y: 682 Bands: 1 Origin -44.9630377200000027,14.1828919999999989 Pixel Size 0.0009997268505872703662,-0.000998533724340174662
-

Estimation des concentrations en moyenne annuelle des particules (PM10) par maille régulière sur la région Normandie pour l'année 2016. Statistiques selon la réglementation en vigueur pour chaque polluant.
-
Estimation des concentrations en moyenne annuelle du dioxyde d'azote (NO2), des particules PM10 et PM2,5 par maille régulière sur l'agglomération de Caen La Mer pour l'année 2017. Le périmètre de la collectivité de Caen la Mer correspond à celui en vigueur en 2014. Statistiques selon la réglementation en vigueur pour chaque polluant.
-
Estimation des concentrations en moyenne annuelle du dioxyde d'azote (NO2), des particules PM10 et PM2,5 par maille régulière sur l'agglomération de Cherbourg en Cotentin pour l'année 2017. Statistiques selon la réglementation en vigueur pour chaque polluant.
-
Estimation des concentrations en moyenne annuelle du dioxyde d'azote (NO2) par maille régulière sur la région Normandie pour l'année 2017. Statistiques selon la réglementation en vigueur pour chaque polluant.
-
Multibeam bathymetry and VHR seismic data acquired on the Lansdowne Bank, New Caledonia (SW Pacific)
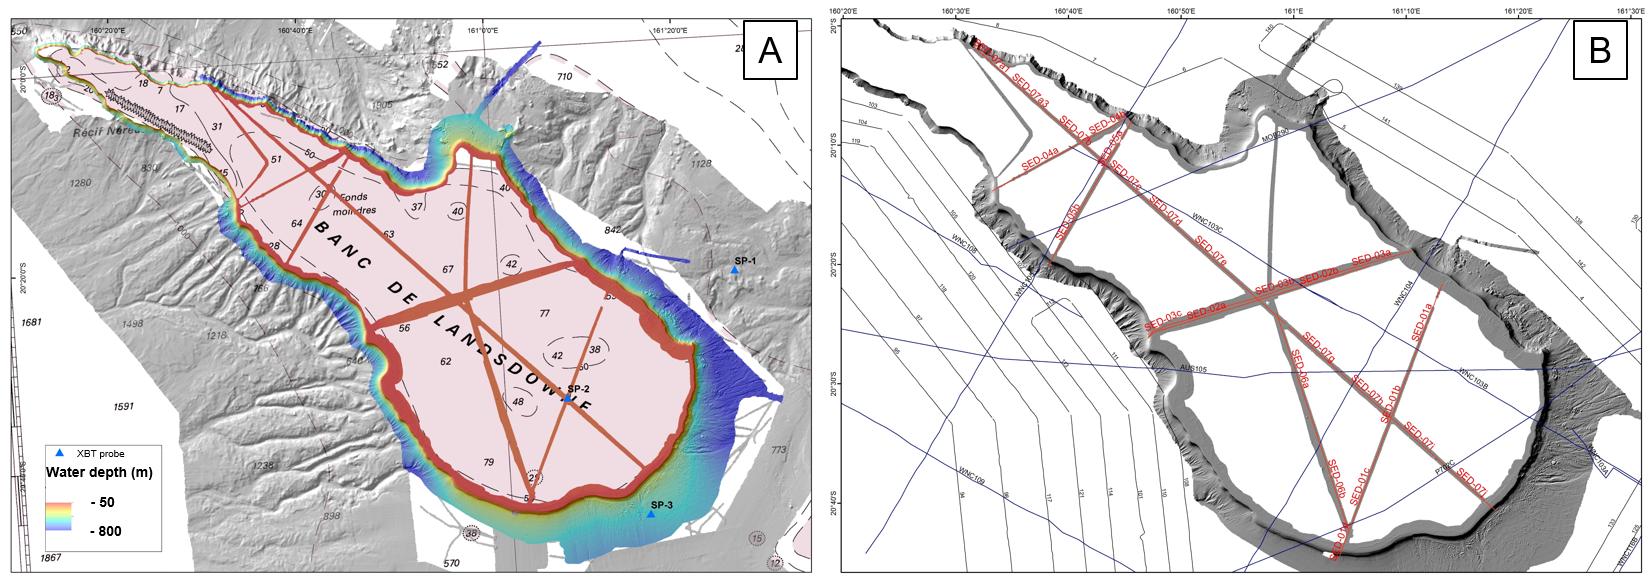
This dataset comprises multibeam bathymetry and very high resolution seismic data acquired over the Lansdowne Bank (New Caledonia, SW Pacific), during the SEDLAB cruise. The latter was a 29 day research cruise on the French national fleet ship R/V ALIS that took place in April and May 2018. The main aim was to characterise the sedimentary dynamics and the stratigraphic architecture of the Lansdowne Bank, a partly drowned, isolated rimmed carbonate platform of around 4000 km2 located offshore New Caledonia in the SW Pacific. More than 2000 km2 of new multibeam data, 7 single-channel SPARKER seismic profiles, along with 15 rock dredges and 8 sediment gravity cores were acquired on the bank top and adjacent slopes. These data reveal that the bank is typified by an almost continuous 4 km wide reef rim located in ca. 50 m water depth, showing typical “spurs and grooves” patterns. This outer rim surrounds a paleolagoon that gently deepens towards the inner platform, reaching up to 100 m water depth. Pinnacle reefs, up to 20 m high, are common close to the external reef rim, but are also scattered within the inner platform. Surprisingly, no obvious transfer axes across the reef rims, internal channels, tidal shoals or any clear current-related bedforms were imaged on the bank top. The bank is bordered by very steep slopes showing numerous bypass features such as canyons, channels and gullies. Additionally, spectacular bank margin collapses were identified. They are evidenced by up to 10 km wide intraslope and bank edge failure scarps, resulting in a scalloped geometry of the bank margin. Scarps are associated with km-sized blocks at the base-of-slope. Integration of all surface and subsurface data, together with post-cruise sedimentological, biostratigraphic and radiometric analyses on rock and sediment samples will hopefully bring new insight into the onset, aggradation and drowning history of the platform in relation to past sea-level changes and vertical tectonic movements. We believe that such results are relevant for the understanding of carbonate slope processes as well as platform-to-basin sediment budgets.
-
Gridded shipboard multibeam bathymetry and backscatter mosaics along the axis of the Mid-Atlantic Ridge. The used data are part of the dataset acquired during the SMARTIES cruise (2019). The gridded datasets cover different portions of the axis of the Mid-Atlantic Ridge south of the Romanche transform fault. Bathymetry grids format: nf = GMT netCDF format (32-bit float), CF-1.7 area NTD1_W grid information: x_min: -16.8647 x_max: -16.716917313 x_inc: 0.000180003272838 name: x n_columns: 822 y_min: -0.0246146868 y_max: 0.0418 y_inc: 0.000179985601084 name: y n_rows: 370 area NTD1_E grid information: x_min: -16.6878 x_max: -16.6098585829 x_inc: 0.000180003272748 name: x n_columns: 434 y_min: -0.0313156947 y_max: 0.0225 y_inc: 0.000179985601003 name: y n_rows: 300 area RC2 grid information: x_min: -16.5302 x_max: -16.3748571756 x_inc: 0.000180003272769 name: x n_columns: 864 y_min: -0.2029041037 y_max: -0.0042 y_inc: 0.000179985601178 name: y n_rows: 1105 area NTD2 grid information: x_min: -16.29 x_max: -16.183078056 x_inc: 0.000180003272727 name: x n_columns: 595 y_min: -0.2707547876 y_max: -0.2056 y_inc: 0.000179985601105 name: y n_rows: 363 area RC3 grid information: x_min: -16.1522 x_max: -16.065078416 x_inc: 0.000180003272727 name: x n_columns: 485 y_min: -0.3490268035 y_max: -0.30907 y_inc: 0.000179985601351 name: y n_rows: 223
-
A MBES acoustic coverage of the PE-1 segment of the SWIR (South West Indian Ridge), more specifically in the vicinity of the dredge 5 location of the SWIFT cruise (2001), was carried out during the SWINGS cruise (https://doi.org/10.17600/18001925) with the French research vessel Marion Dufresne in 2021. SWINGS data were acquired with the hull-mounted multibeam echosounder Kongsberg EM122 12 kHz using an optimised configuration for bathymetry data collection: vessel speed of 5 knots, dual swath, CW signal and an angular opening of 120°. Acoustic data were processed with GLOBE software (https://doi.org/10.17882/70460) to provide a high-resolution bathymetry map (grid resolution of 15 m).
-
Ce produit contient, sous forme de fichiers shapefile et geotiff, les données numériques du Shom relatif aux courants de marée 3D sur la zone "LOIRE". Ces fichiers numériques indiquent les composantes du courant de marée à plusieurs immersions, heure par heure et pour deux coefficients de marée caractéristiques (45 et 95). Le port de référence est le port de Saint-Nazaire. Trois couches sont proposées : - Surface; - mi-profondeur - fond.