 Metadata catalogue
service-view
Type of resources
Available actions
INSPIRE themes
Keywords
Contact for the resource
Provided by
Years
Formats
Update frequencies
status
Service types
-

INSPIRE View Service enables access to soil maps at a scale of 1 : 50,000 of the new digital edition of the Czech Geological Survey (since 2012).
-

INSPIRE View Service provides access to mapped landslides in the Czech Republic.
-

Example Map Application Pre-Quarternary Map.
-
Geoportal - Tiled view service (WMTS)
-
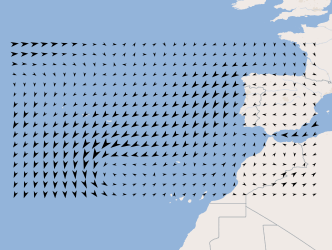
Three-hourly forecast maps of wind direction and intensity at 10 meters in the Atlantic region, generated daily from ECMWF data, with forecasts every 3 hours of the current day from 00h to the next 120 hours. This visualization service includes the individual layers and also a multidimensional layer that brings all of them together.
-
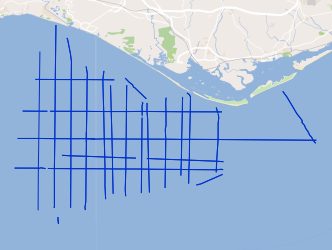
ASTARTE geophysical campaigns aim to collect the necessary information for the assessment, strategy and risk reduction for Tsunamis in Europe.
-
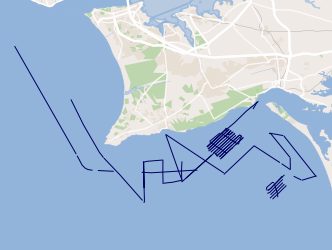
This project aims to characterize the evolution of the coastline during the Quaternary and discern what were the contributions to this evolution: 1) neotectonic, 2) eustatic variations and 3) sedimentary transport.
-
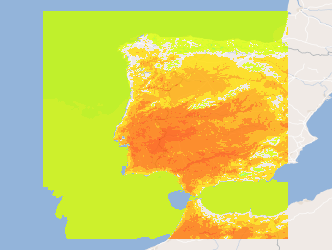
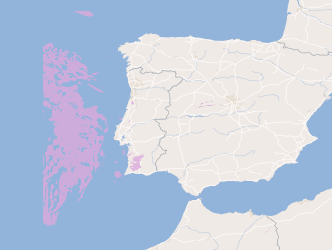
Three-hourly forecast maps of air temperature at 2 meters in Kelvin in the Iberian Peninsula, generated with the AROME model at 12UTC for the next 48 hours. This visualization service includes the individual layers and also a multidimensional layer that brings all of them together.
-
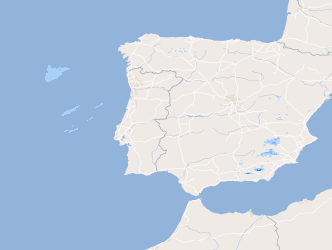
Three-hourly forecast maps of medium cloud cover in percentage in the Iberian Peninsula, generated with the AROME model at 00UTC for the next 48 hours. This visualization service includes the individual layers and also a multidimensional layer that brings all of them together.
-
Three-hourly forecast maps of accumulated precipitation in mm/3h in the Iberian Peninsula, generated with the AROME model at 12UTC for the next 48 hours. This visualization service includes the individual layers and also a multidimensional layer that brings all of them together.