 Metadata catalogue
oceans
Type of resources
Available actions
Topics
INSPIRE themes
Keywords
Contact for the resource
Provided by
Years
Formats
Representation types
Update frequencies
status
Scale
Resolution
-
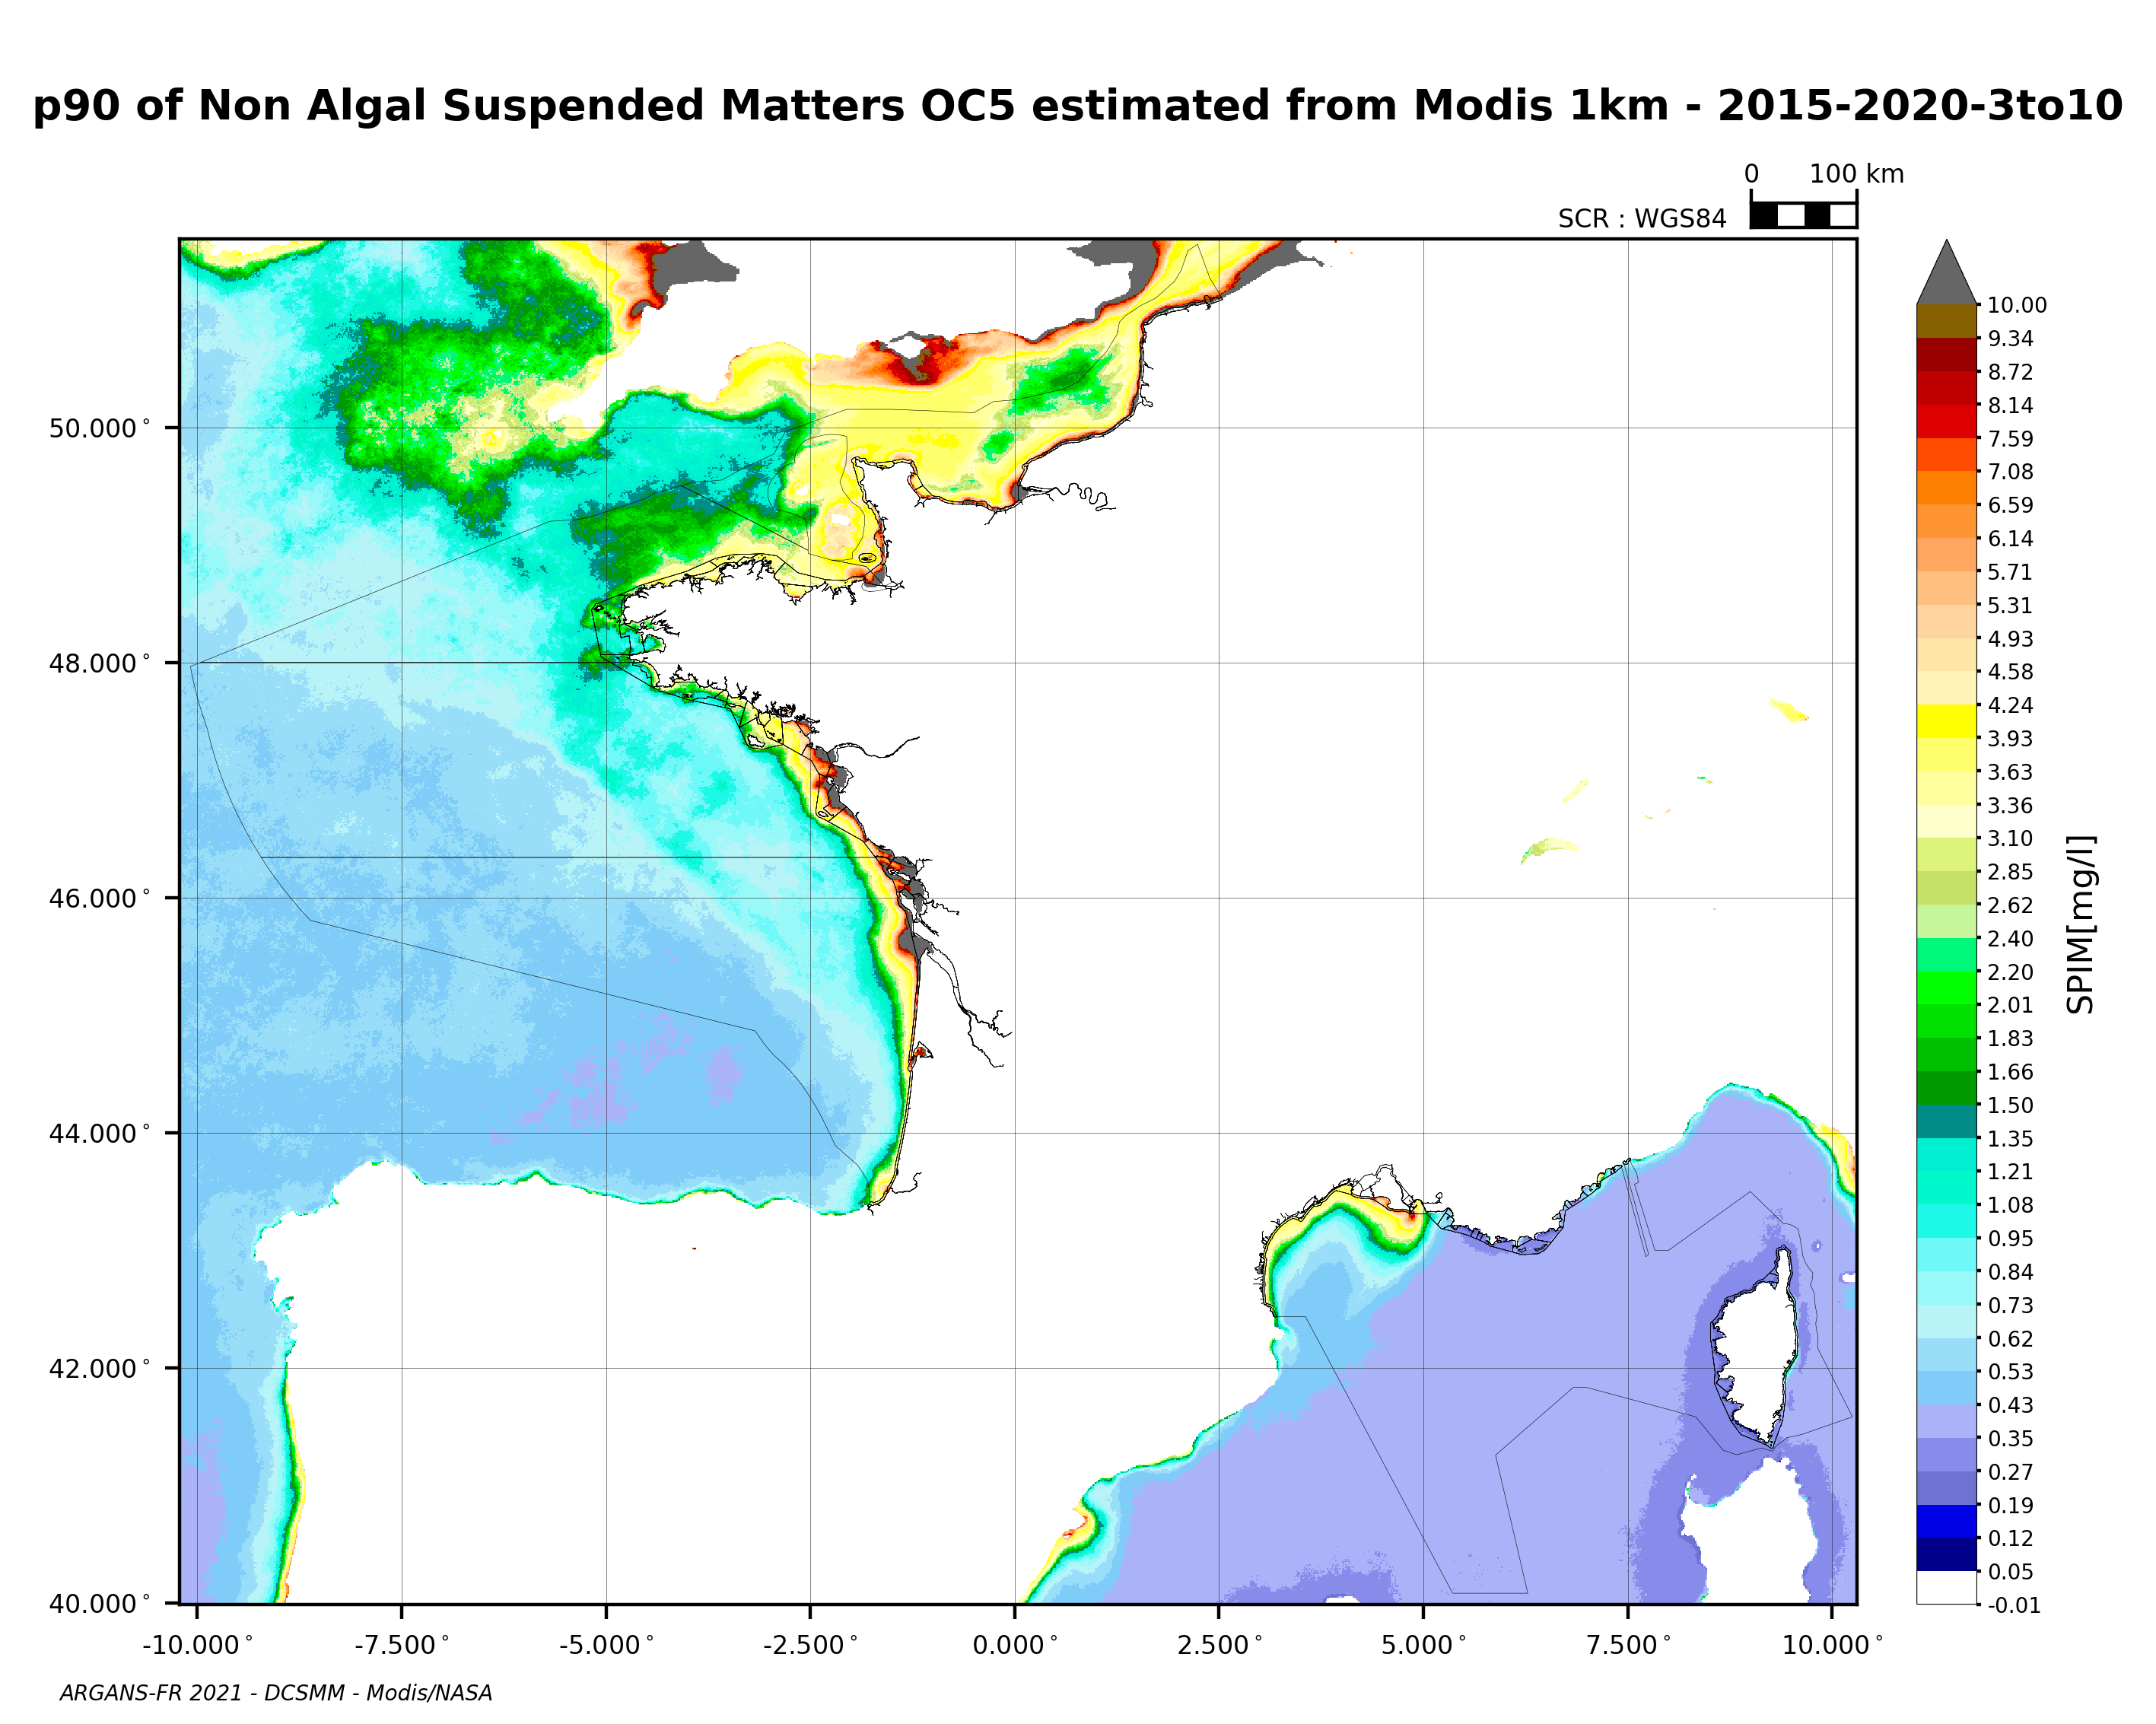
90th percentile of non-algal suspended matter calculated during the productive period of the WFD (March-October) from 2015 to 2020, from the MODIS algorithm processed by OC5 IFREMER/ARGANS (Gohin et al 2002, Gohin 2011).
-

The Geological Survey Ireland (GSI), as partner and Work Package 7 (Minerals) leader of EMODnet Geology Phase III, are compiling information on marine sapropel sites. EMODnet partners are submitting the spatial extent of mapped deposits and established information; here you can view data collated thus far. Need abstract information here.....
-

Terraces are defined as a step-like landform and can be sub-divided thus: 1. Marine (1a: erosional / 1b: depositional); 2. Fluvial (2a: erosional / 2b: depositional); 3. Lacustrine (3a: erosional / 3b: depositional); 4. Other. Further information on genesis of the terrace e.g. Erosional (e.g. wave-cut platform), Depositional (e.g. fluvial margins) is presented if known. Chronological information is presented as calendar age BP. Confidence is defined as follows: 1. High: Sampled feature with good age and palaeoenvironmental control. 2. Sampled feature with poor or none age and palaeoenvironmental control. 3. Constructed by remote sensing data only. 4. Low: Reasonable without any direct evidence.
-

Pan-European map of morphological and lithological coastal type at zoomable scale. The map is collated and harmonised from geological maps provided by partners of EMODnet Geology. Where no such data were available, information from the EUROSION project is provided. The main attributes denote several types of rocky coast, beach, inshore area and artificial coast. The current version was finalised in May 2021.
-

Thanks to the public availability of satellite data (optical imagery of ESA Sentinel 2 and NASA Landsat 5, 7 & 8 with pixel resolutions of 10-30 metres and a revisit time of 1 to 2 weeks) and new analytical tools for processing big data (such as the Google Earth Engine), the EMODnet Geology team in collaboration with Deltares and TNO (Geological Survey of the Netherlands) were able to look at shoreline migration in a new way. Scripts for automated detection of the land-water boundary were used to separate land from water in annual image composites for the period 2007-2017. During this process, data points were generated for each part along the European shoreline. These points were then averaged by year and analysed for a decadal period. Visualising pan-European shoreline change means making choices, like defining a stable shoreline for example. A mean rate of 0.5 metre per year was chosen, though this rate depends on the landscape: granite cliffs for example shows less decadal dynamics compared to a sandy barrier island. The spatial resolution of the method, depending on the pixel resolution of the individual satellite images which is about 10 metres, is still limiting. Validations of abovementioned method have shown that the method is less accurate in case of bluffs, cliffs and muddy coasts, and as such further validations will need to take place. EMODnet Geology hopes that by releasing the satellite-based dataset now, coastal experts and other end users will be able to discover and communicate possibilities and limitations of automated methods for the extraction of shoreline position and quantification of annual to decadal change. To help in this process, a companion map showing shoreline migration on the basis of field data and expert is made available, thereby facilitating a first-order comparison.
-

The Geological Survey Ireland (GSI), as partner and Work Package 7 (Minerals) leader of EMODnet Geology Phase III, are compiling information on marine hydrocarbon deposits. EMODnet partners are submitting the spatial extent of mapped deposits and established information; here you can view data collated thus far. Oil and gas deposits include information such as deposit type, deposit sub type, economic feasibility, scale, status, operator, block name, data provider, host rock, area, depth to resource, references and comments.
-

The shoreline is a highly dynamic land-sea interface that provides important services such as ecology, flood protection and recreation. It is constantly modified by wind, waves and tides, and impacted by human activity. Hence, the decadal change of shorelines reflect natural processes as well as human influence, whether positive or negative. Climatic-driven changes such as sea level rise, higher waves and changes in wind direction put increasing pressure on many of Europe’s shorelines. Knowing how, and at what rate, our coasts are changing is the first step to successfully managing them. The new EMODnet Geology shoreline-migration map, released today, allows users to visualise pan-European coastal behaviour for 2007-2017 at different spatial scales. A built-in search and zoom functionality allows online users to distinguish areas of landward migration (erosion or submergence), stability, and seaward migration (accretion or emergence). The underlying, downloadable satellite-based dataset offers additional information on annual values and uncertainty. With the new map, international policy makers can determine large-scale coastal vulnerability while national and regional coastal managers are able to fill existing gaps in field-monitoring data and to identify potential areas of rapid change. The map also provides the general public with a useful insight into one of Europe’s most obvious climate-change effects. Most importantly, scientists may explain spatial patterns and provide feedback on methodological advantages as well as shortcomings, thus helping to optimise the big-data methodology used.
-

Submerged archaeological sites subdivided as: 1. Cave site; 2. Open air site; 3. Settlement; 4. Other. Chronological information is presented as calendar age BP. Confidence is defined as follows: 1. High: Sampled feature with good age and palaeoenvironmental control. 2. Sampled feature with poor or none age and palaeoenvironmental control. 3. Constructed by remote sensing data only. 4. Low: Reasonable without any direct evidence.
-

Pan-European coastline-migration map at zoomable scale. The map is collated and harmonized from field-monitoring data and aerial photography provided by partners of EMODnet Geology. Where no such coastline-migration data were available, information from the EUROSION project is provided. For remaining gaps, please consult the coastline-migration map based on satellite data. The main attributes denote degree of landward (by erosion or submergence) or seaward (by accretion or emergence) change. In the visualization provided, three classes are distinguished: landward migration, stable coastline, seaward migration. The criterion for stable coastlines is ≤0.5 meter net change per year over a 10-year period. The current version was finalized in January 2021.
-

Evaporites are crystalline sedimentary rocks that form by the evaporation of natural brines. Having complex mineralogy, there are many varieties of evaporites; the most economically important minerals include: calcite, gypsum, anhydrite, halite, polyhalite, sylvite, carnallite, kainite, kieserite and anhydrite. Although evaporite deposits formed in ancient marine basins are extensive on land, many of these also extend beneath the sea, not only beneath the continental shelves but also under some marginal ocean basins. Present day occurrences of subsea anhydrite, potash and magnesium evaporite deposits have been described along the margins of the Mediterranean Sea as well as in the North Sea and West Baltic Sea.