Metadata catalogue
NetCDF
Type of resources
Available actions
Topics
INSPIRE themes
Keywords
Contact for the resource
Provided by
Years
Formats
Representation types
Update frequencies
status
Scale
Resolution
-

This L4 SST product is produced at ultra-high resolution (UHR) on a 0.02 x 0.02 degree grid (approximately 2 x 2 km) for the Tropical Atlantic area, every 24 hours. Optimal interpolation (OI) techniques are used to combine coincident swath measures of SST from different types of sensor and to fill gaps where no observations are available. Whereas swath data essentially represent the skin or sub-skin SST, the L4 SST product is defined to represent the SST foundation (SSTfnd). SSTfnd is defined within GHRSST-PP as the temperature at the base of the diurnal thermocline. It is so named because it represents the foundation temperature on which the diurnal thermocline develops during the day. SSTfnd changes only gradually along with the upper layer of the ocean, and by definition it is independent of skin SST fluctuations due to wind- and radiation-dependent diurnal stratification or skin layer response. It is therefore updated at intervals of 24 hrs. SSTfnd corresponds to the temperature of the upper mixed layer which is the part of the ocean represented by the top-most layer of grid cells in most numerical ocean models. It is never observed directly by satellites, but it comes closest to being detected by a microwave radiometer which penetrates the skin, at dawn when the previous day's diurnal stratification can be assumed to have decayed and SSTsubskin, SSTdepth and SSTfnd are equal.
-
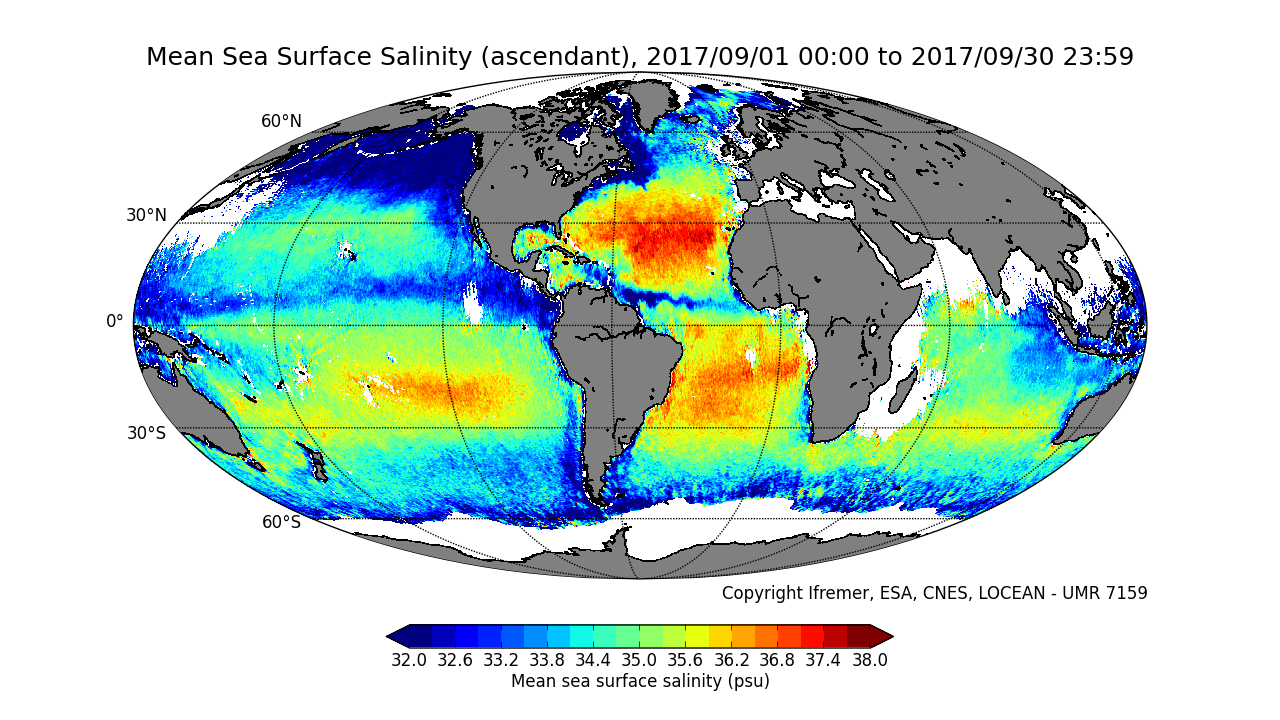
This product contains average 10 days & monthly salinity field based on L2P products, ascending and descending orbits being processed separately. ** This product is no longer available, see below **
-
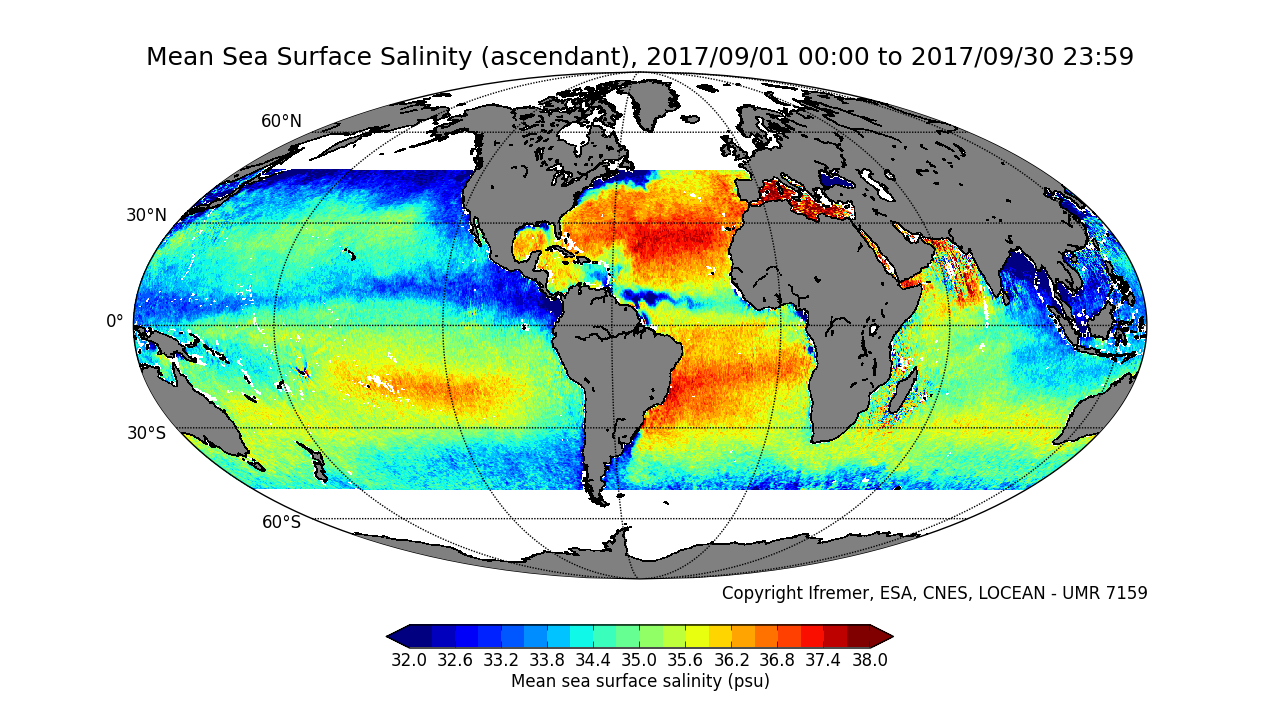
This product contains average 10 days & monthly salinity field corrected from land-sea contamination and latitudinal bias, based on L2Q products, ascending and descending orbits being processed separately. ** This product is no longer available, see below **
-
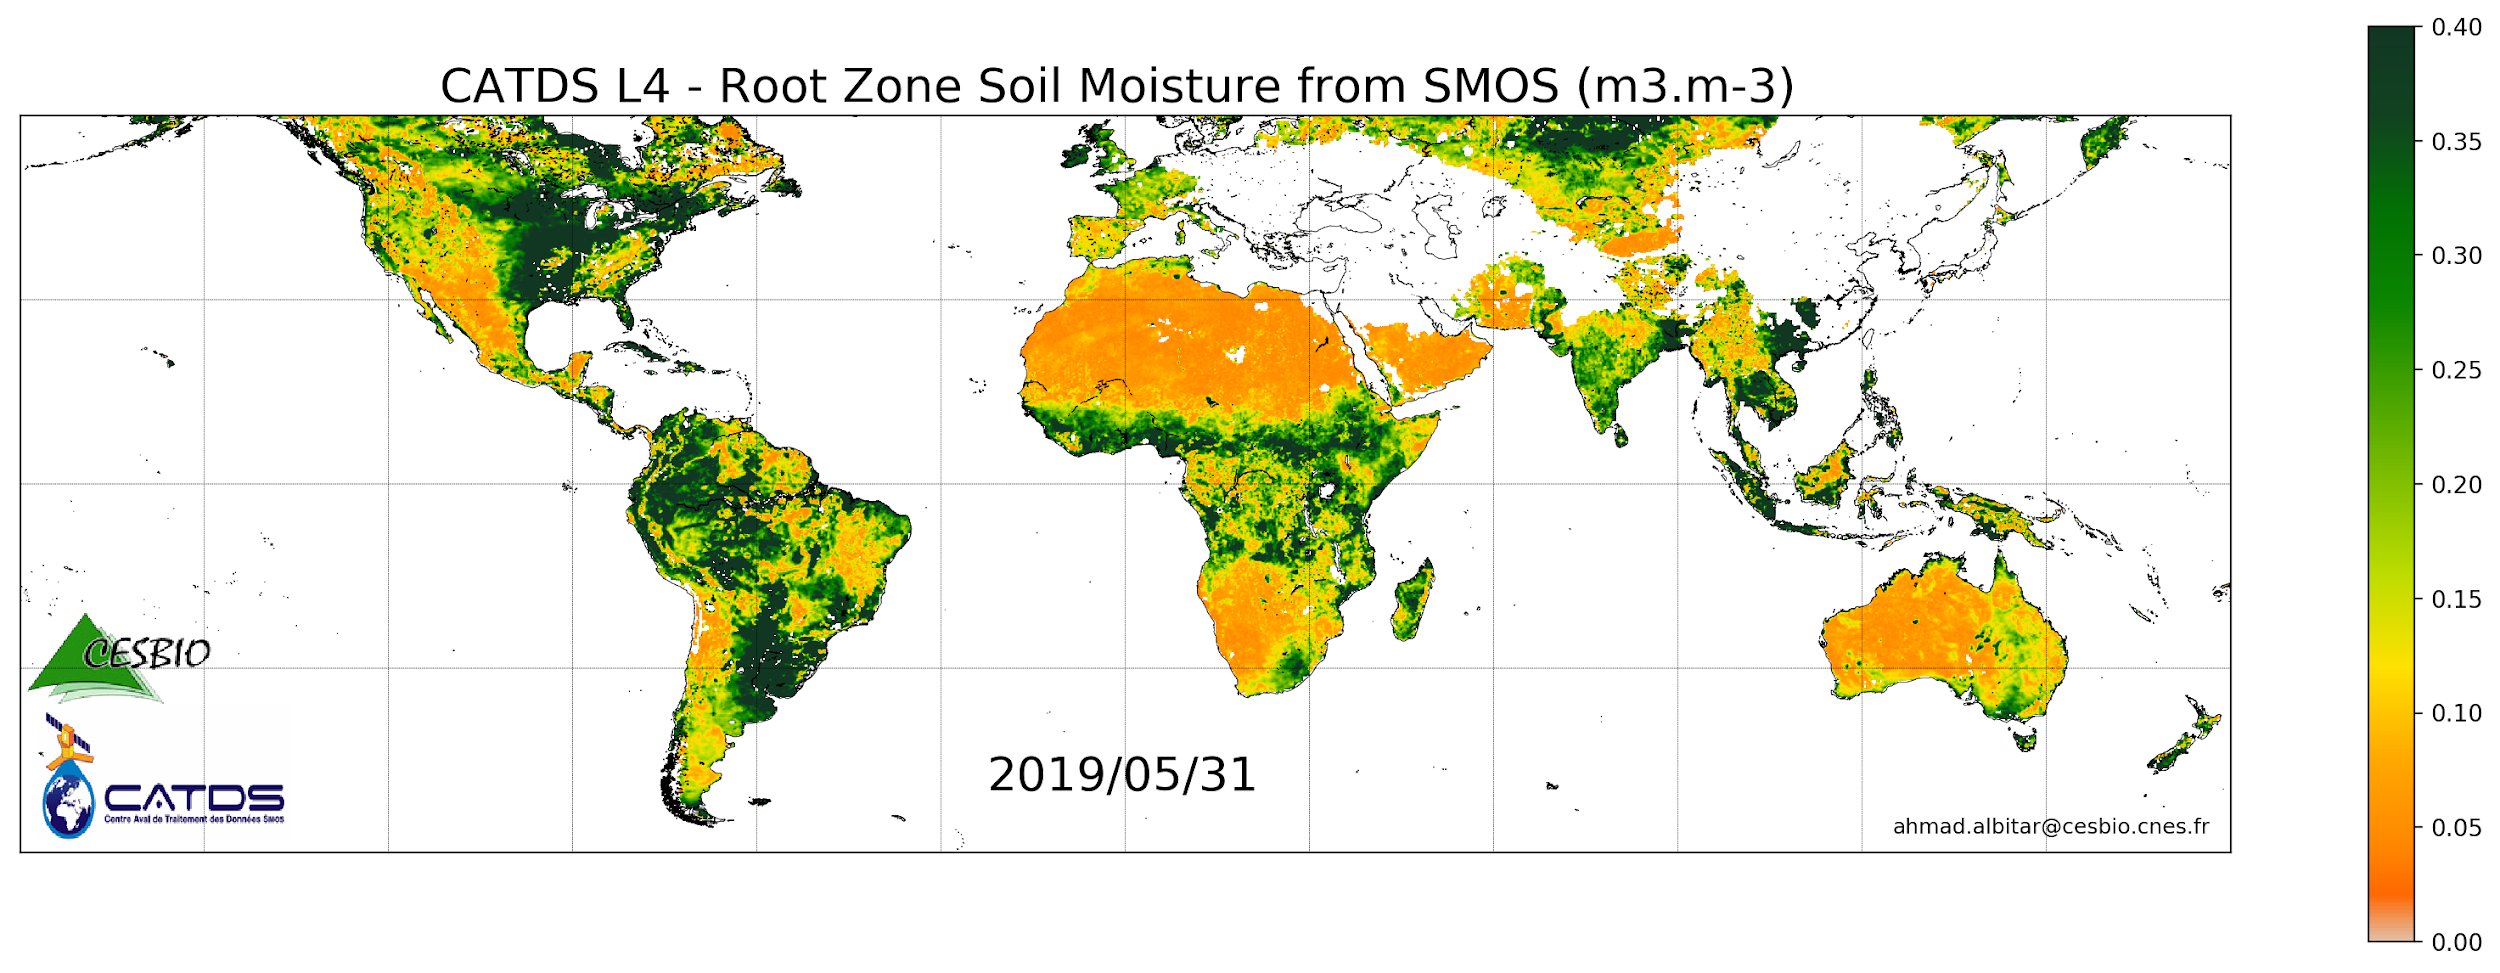
This product is a daily product of root zone soil moisture representative of the 0-1 m depth of the soil. Only descending orbits are processed.
-
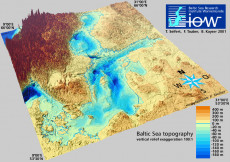
The data sets presented here provide a digitised topography of the Baltic Sea. Land heights and water depths have been calculated for two regular spherical grids from available data. Data set "iowtopo2" covers the whole Baltic Sea from 9° to 31° East and from 53°30’ to 66° North by (660 x 750) grid cells, see Fig. 1. The resolution is 2 minutes with respect to longitude, and 1 minute to latitude. This is approximately 1 nautical mile, or 2 km resp. The region of the Belt Sea from 9° to 15°10’ East and from 53°30’ to 56°30’ North, see Fig 2, is comprised within data set "iowtopo1" with a twofold higher resolution (1 minute in longitude and 0.5 minutes in latitude corresponding to approx. 1 km). The data specify a representative average of the water depth or the land height of each grid cell, counted by negative and positive values in meters. Some statistical parameters allow a rough estimate of the reliability of the data. (Please be aware that data are rather uncertain in regions where strong gradients of the bottom relief occur, esp. the northern parts of the Baltic. There is an urgent need of further bathymetry data to become available for the Baltic beyond 59° North.) Since a common average of land heights and water depths lead to rather unsatisfying results with respect to the gridded shoreline, a landmask is proposed in both data sets. The landmasks were derived from the global high resolution shorelines GSHHS and RANGS, and used to get a "naturally looking" composite topography (z_topo see below). Citation: T. Seifert, F. Tauber, B. Kayser: 2001: "A high resolution spherical grid topography of the Baltic Sea – 2nd edition", Baltic Sea Science Congress, Stockholm 25-29. November 2001, Poster #147,
-
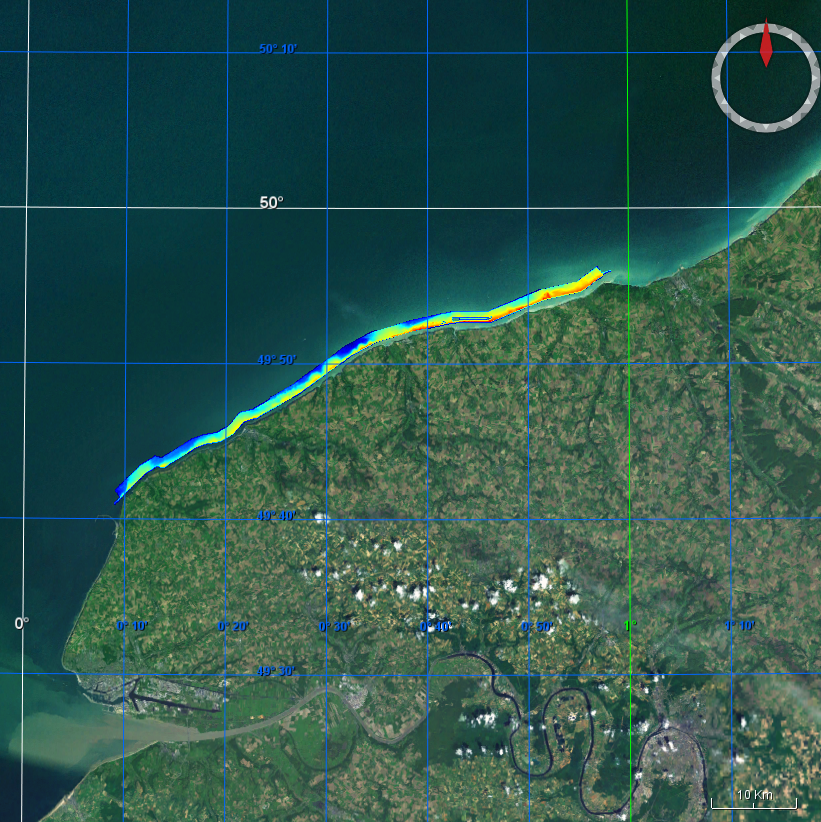
Grid processed for the purpose of the HR DTMs layer of EMODnet Bathymetry HRSM, October 2020
-
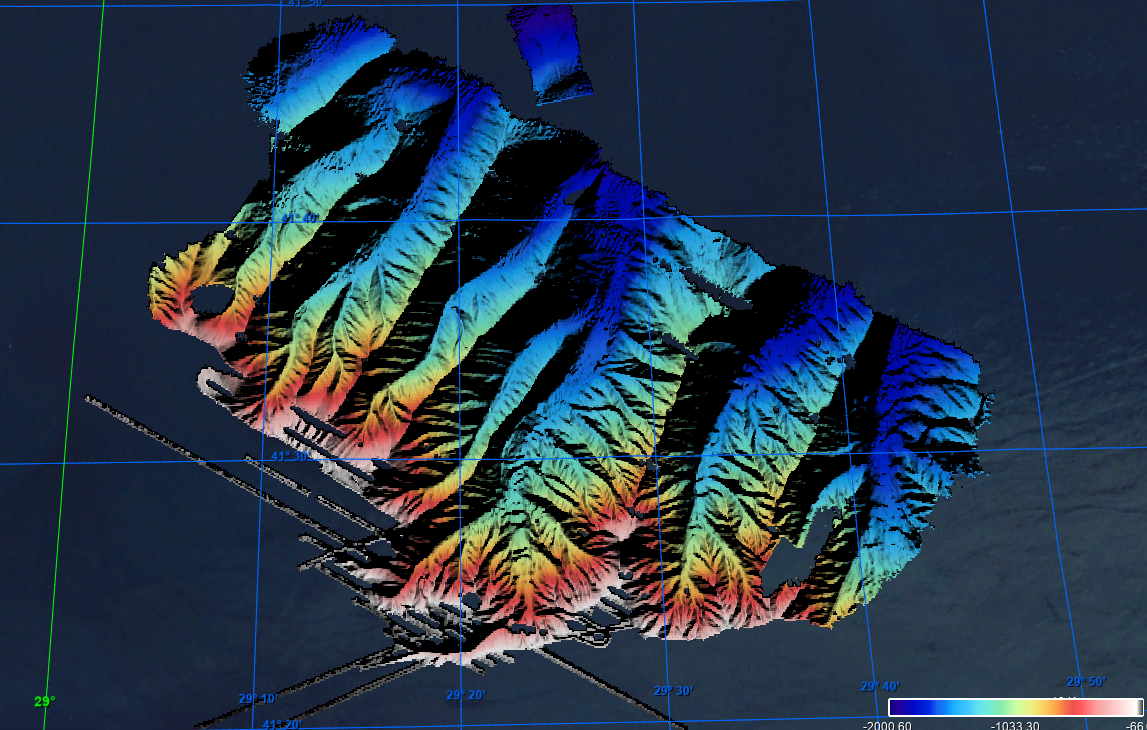
This composite Digital Terrain Model (cDTM) is a high resolution bathymetry dataset that covers CASCADES-I, CASCADES-II, COSTEM-1, COSTEM-2, COSTEM-3, COSTEM-4, FORMED-2, FORMED-4 and FORMED-6 cruises. Multibeam data acquired in 2008, 2009, 2010, 2011, 2013, 2014 and 2015 on board the R/V Sarmiento de Gamboa and the R/V García del Cid with an Atlas Hydrosweep DS-3 and an Elac Seabeam 1050D echo-sounder.
-
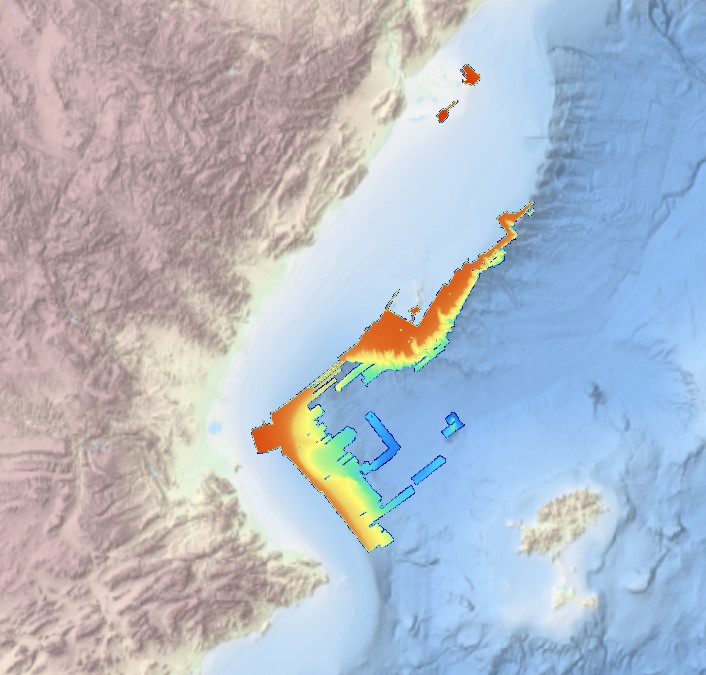
This composite Digital Terrain Model (cDTM) is a high resolution bathymetry dataset that covers SALTFLU cruise. Multibeam data acquired in 2012 on board the R/V OGS Explora with a Reason 8150 echo-sounder
-
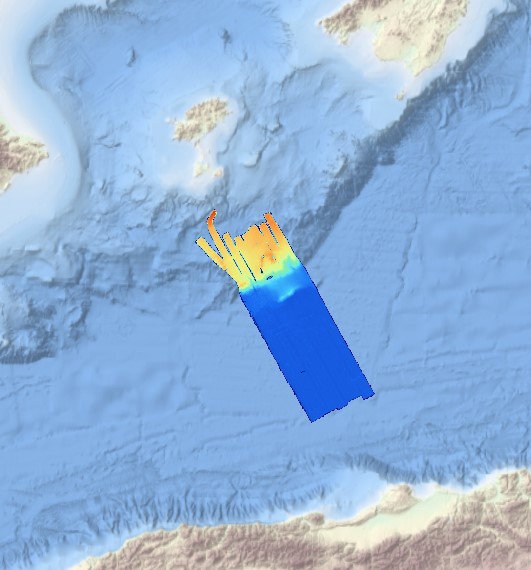
Multibeam data acquired during the PLA-HANO survey. R/V Thalia, 2006, EM1000 multibeam system.
-