 Metadata catalogue
2025
Type of resources
Available actions
Topics
INSPIRE themes
Keywords
Contact for the resource
Provided by
Years
Formats
Representation types
Update frequencies
status
Service types
Scale
Resolution
-
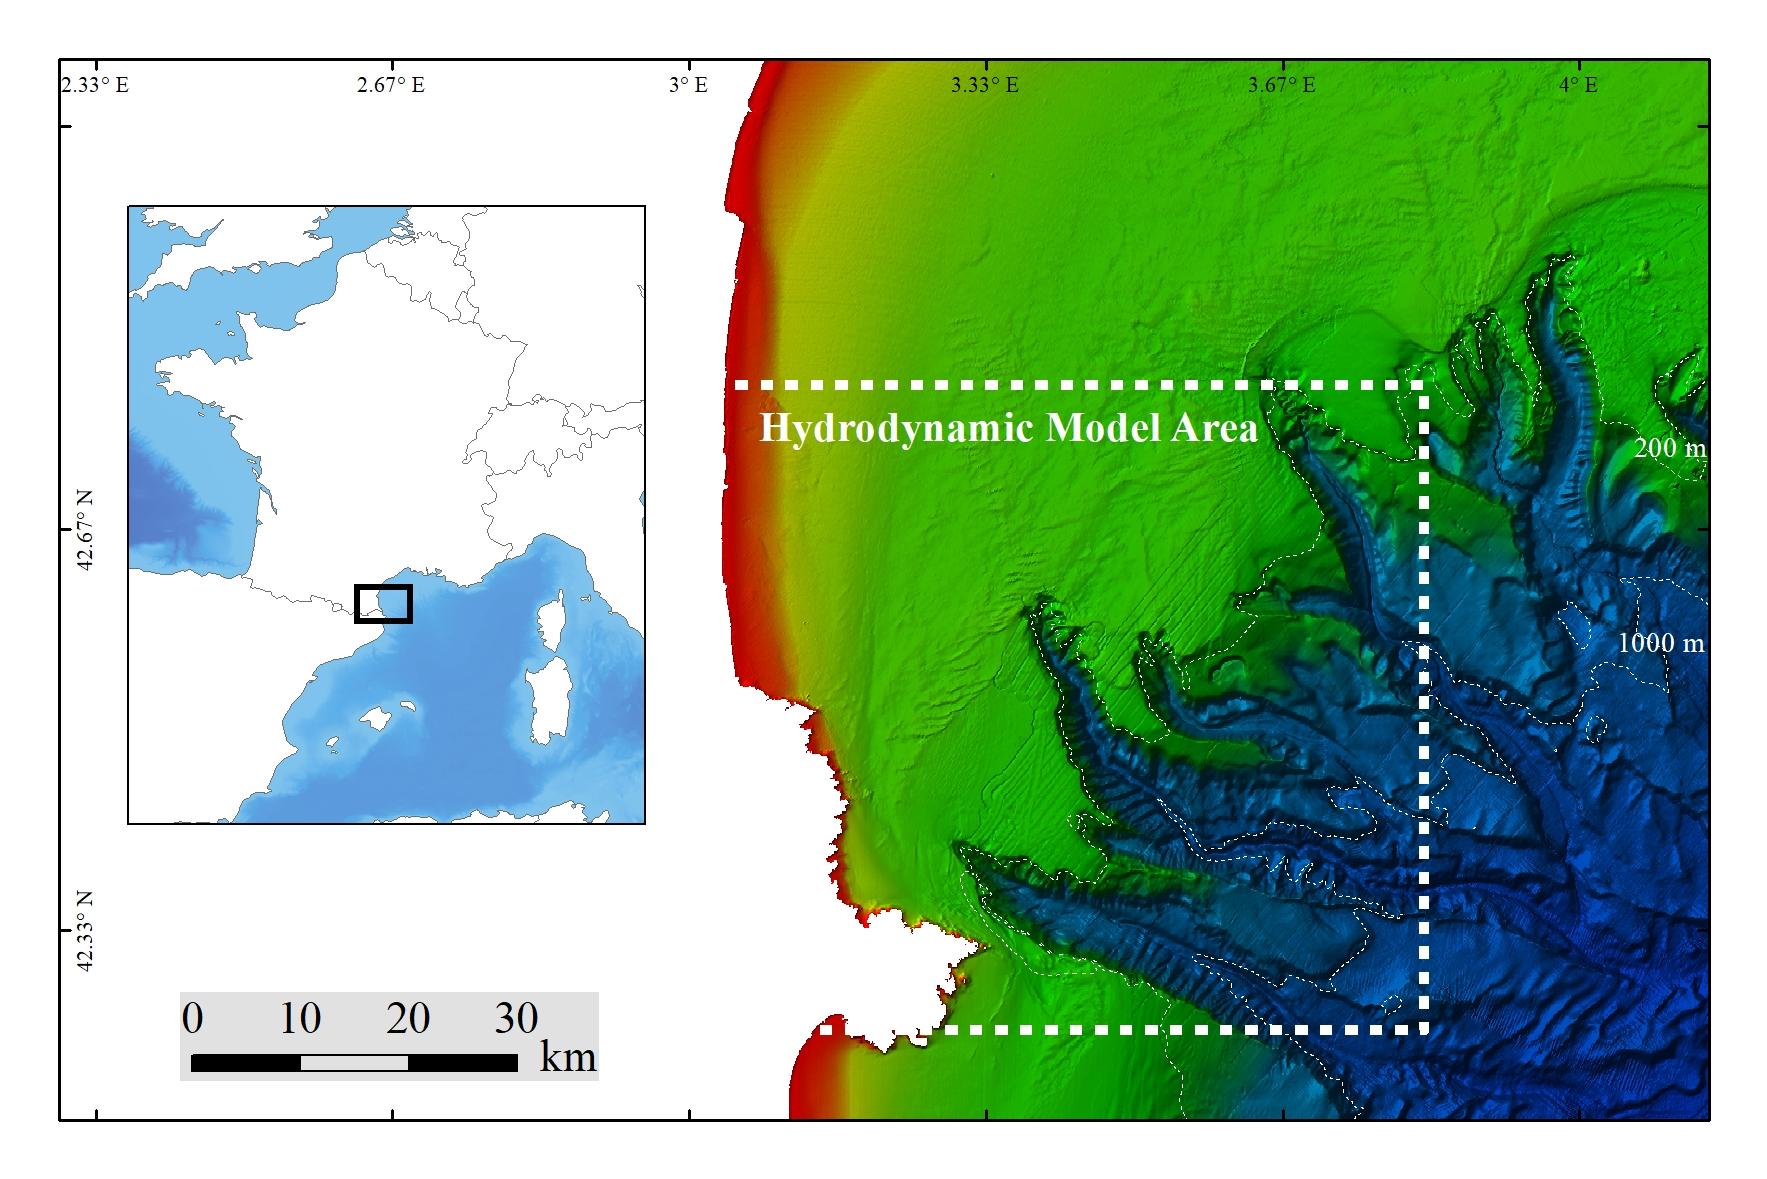
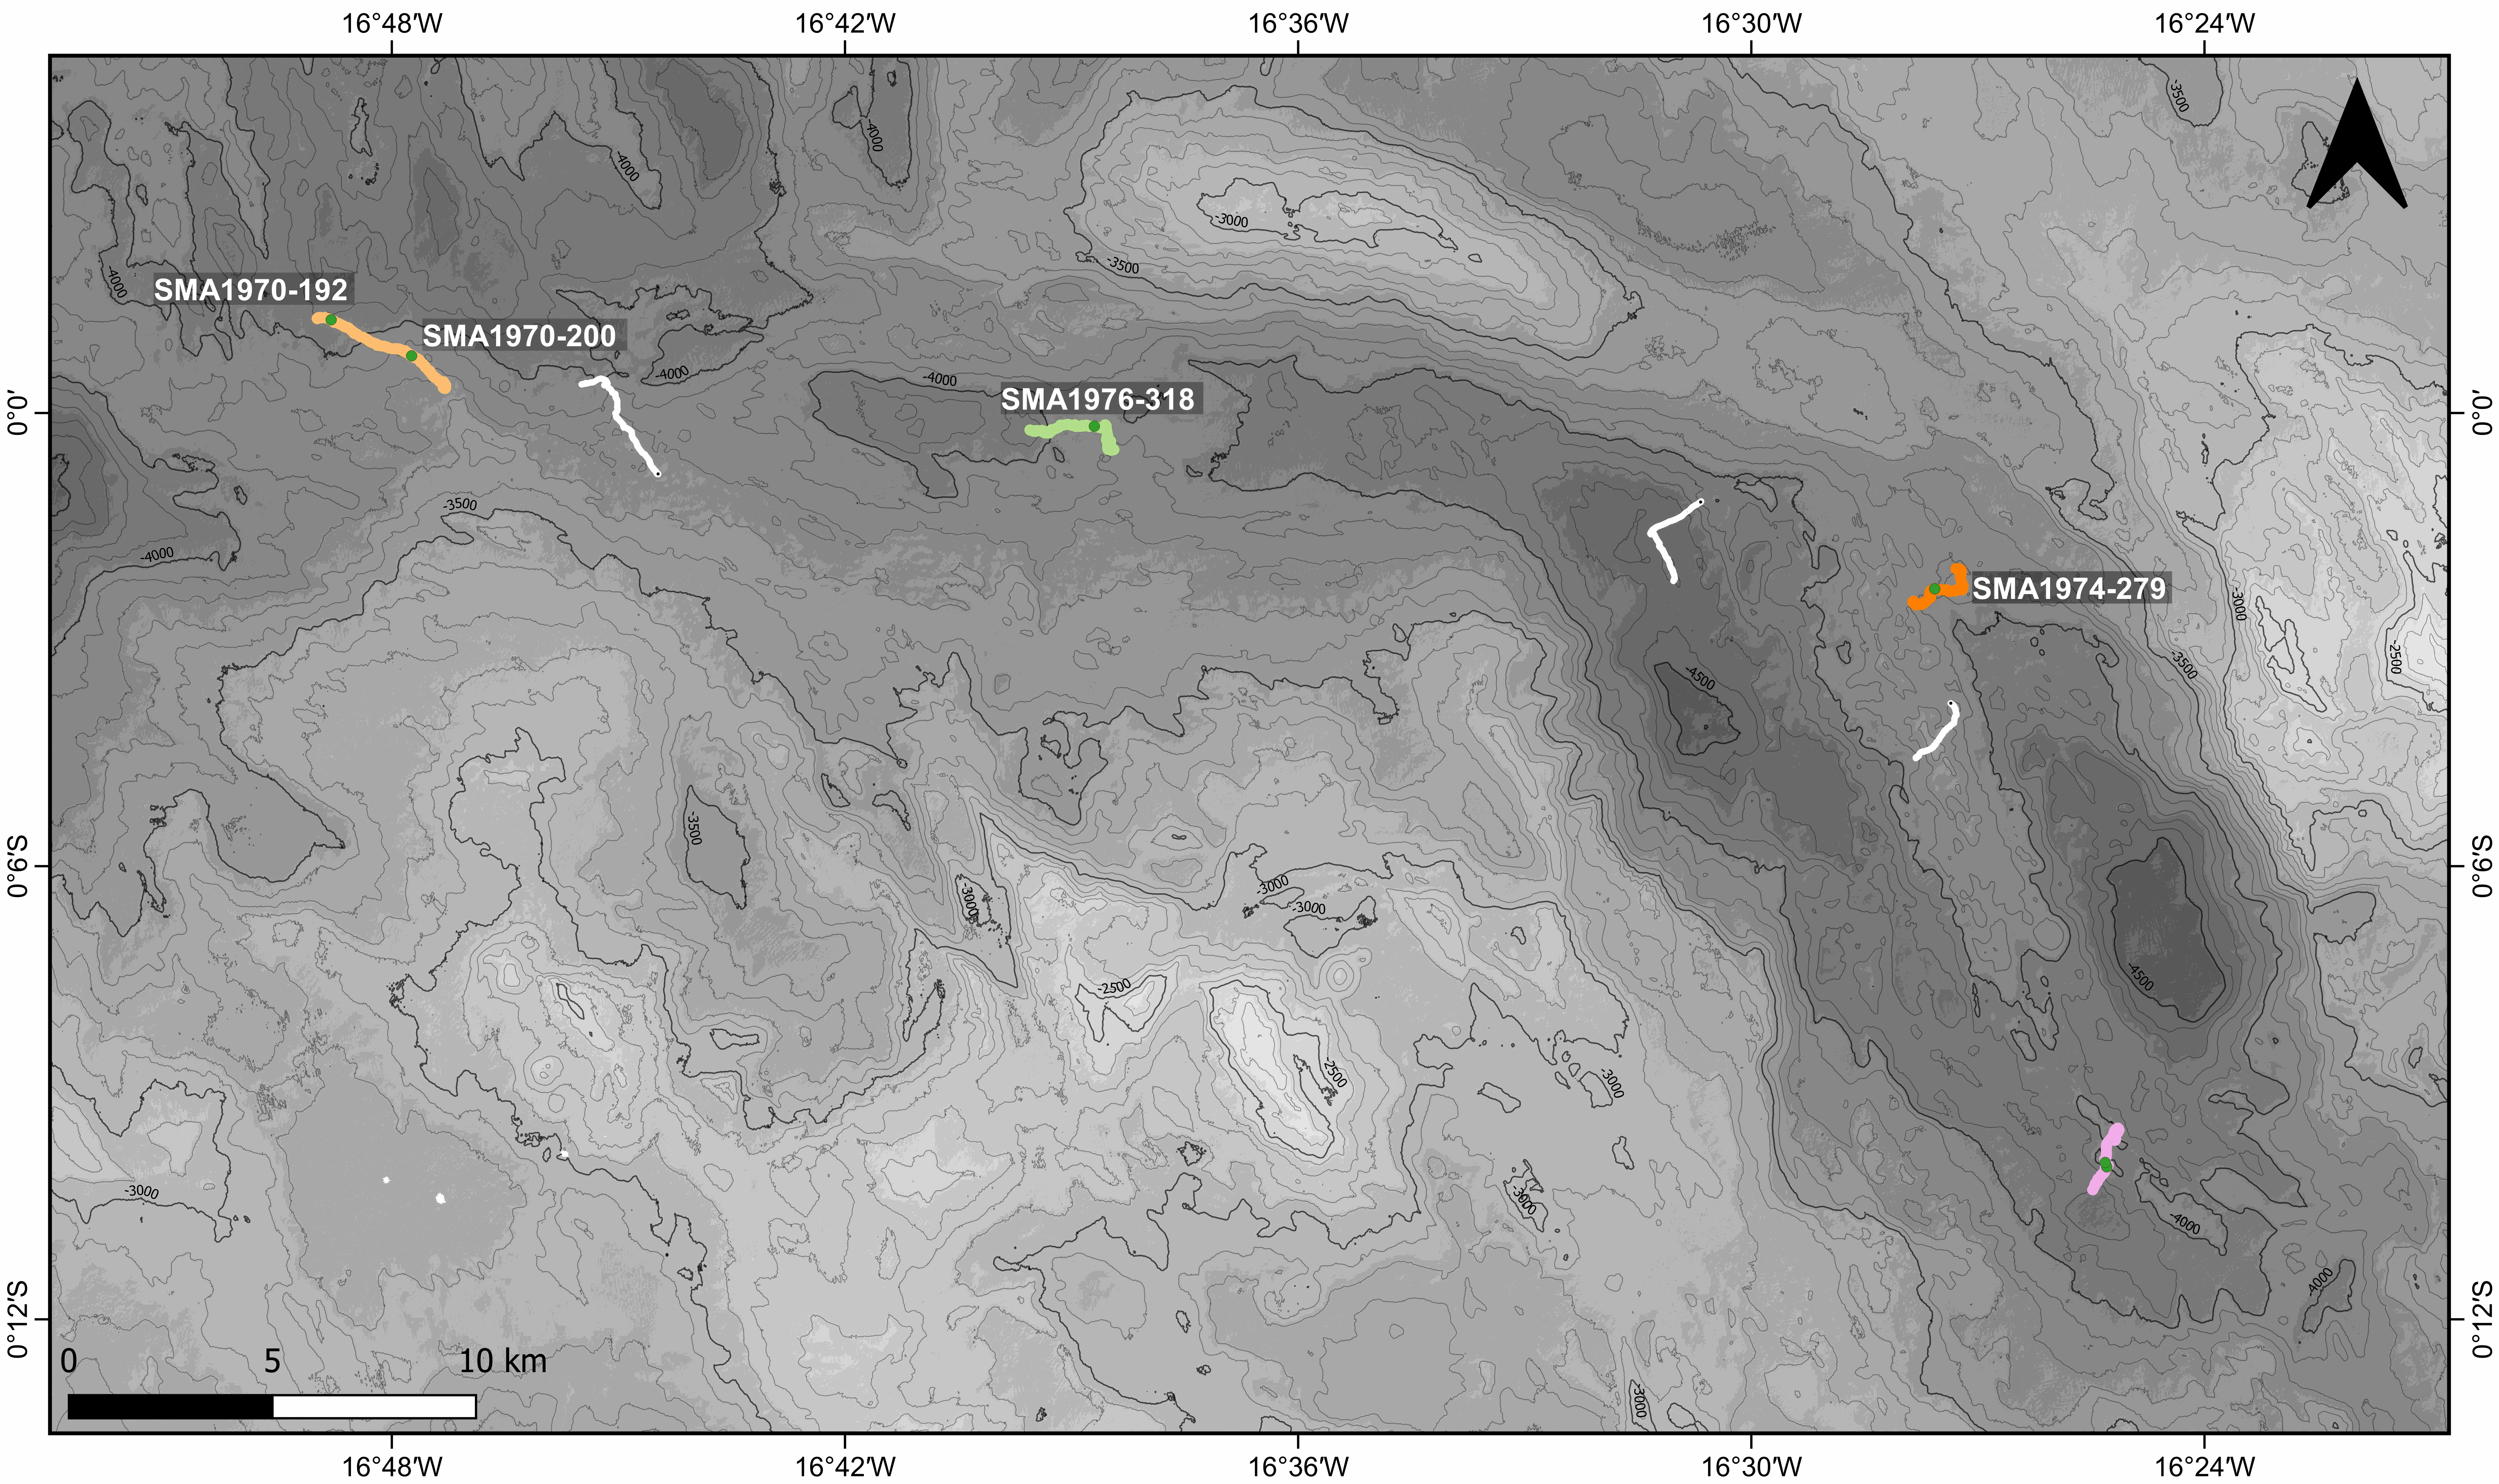
Extreme percentiles (1%, 5%, 95%, 99%) of bottom temperature and salinity, as well as (95%, 99%) of bottom currents, were modeled using SYMPHONIE on a numerical domain covering 65 × 60 km at a resolution of 80 m. The 10-m bathymetry used inside the Lacaze-Duthiers Canyon was collected during the CALADU_2021 cruise (https://doi.org/10.17600/18001575). Statistics of extreme values were derived from hourly fields simulated between November 1, 2012, and April 15, 2014. This period includes two contrasting winters: the winter of 2012–2013, which was cold with dense water cascading, and the winter of 2013–2014, which was warm. This dataset was produced to assess the probable distribution of habitats (habitat suitability modeling) for cold-water corals in the Lacaze-Duthiers Canyon at different resolutions as part of the European H2020 project REDRESS (Restoration of Deep-Sea Habitats to Rebuild European Seas, https://redress-project.eu/, Grant Agreement No. 101135492). SYMPHONIE is a component of the national service SIROCCO (research infrastructure ILICO). This dataset is related to the article "Mapping and Conservation of Cold-Water Corals in the Lacaze-Duthiers Canyon for Transboundary Management", submitted to Mediterranean Marine Science by Fabri et al. in 2025.
-

Bathymetric data were acquired in Reao Atoll, a semi-enclosed atoll lagoon without reef pass but connected to ocean through numerous shallow spillways (known locally as "hoa") along its southern rim. This data was acquired as part of the GAIA (ManaGement strAtegy evaluatIon for small-scale fisheries in Atoll lagoons) project, which evaluates the sustainability of giant clam exploitation within the context of climate change. The lagoon of Reao is composed of three basins with varying depths (the NW basin being the shallowest and the SE basin the deepest). Bathymetric data were acquired from 29/04/2022 to 04/05/2022, within the lagoon with a Multibeam echo sounder IWBMS (NORBIT), and resampled at 5 m spatial resolution. Satellite-derived-bathymetry (SDB) at 10 m spatial resolution was established by coupling this bathymetric data with a Sentinel-2B image captured on 26/09/2020 and using the « Iterative Multi Band Ratio » technique (detailed methodology is described in Quéré et al. 2025). Finally, bathymetric surveys were carried out to characterize the nine most functional hoa of the atoll. One bathymetric survey was carried out in the longitudinal section of each hoa, while one or two surveys were carried out in their cross-sections.
-
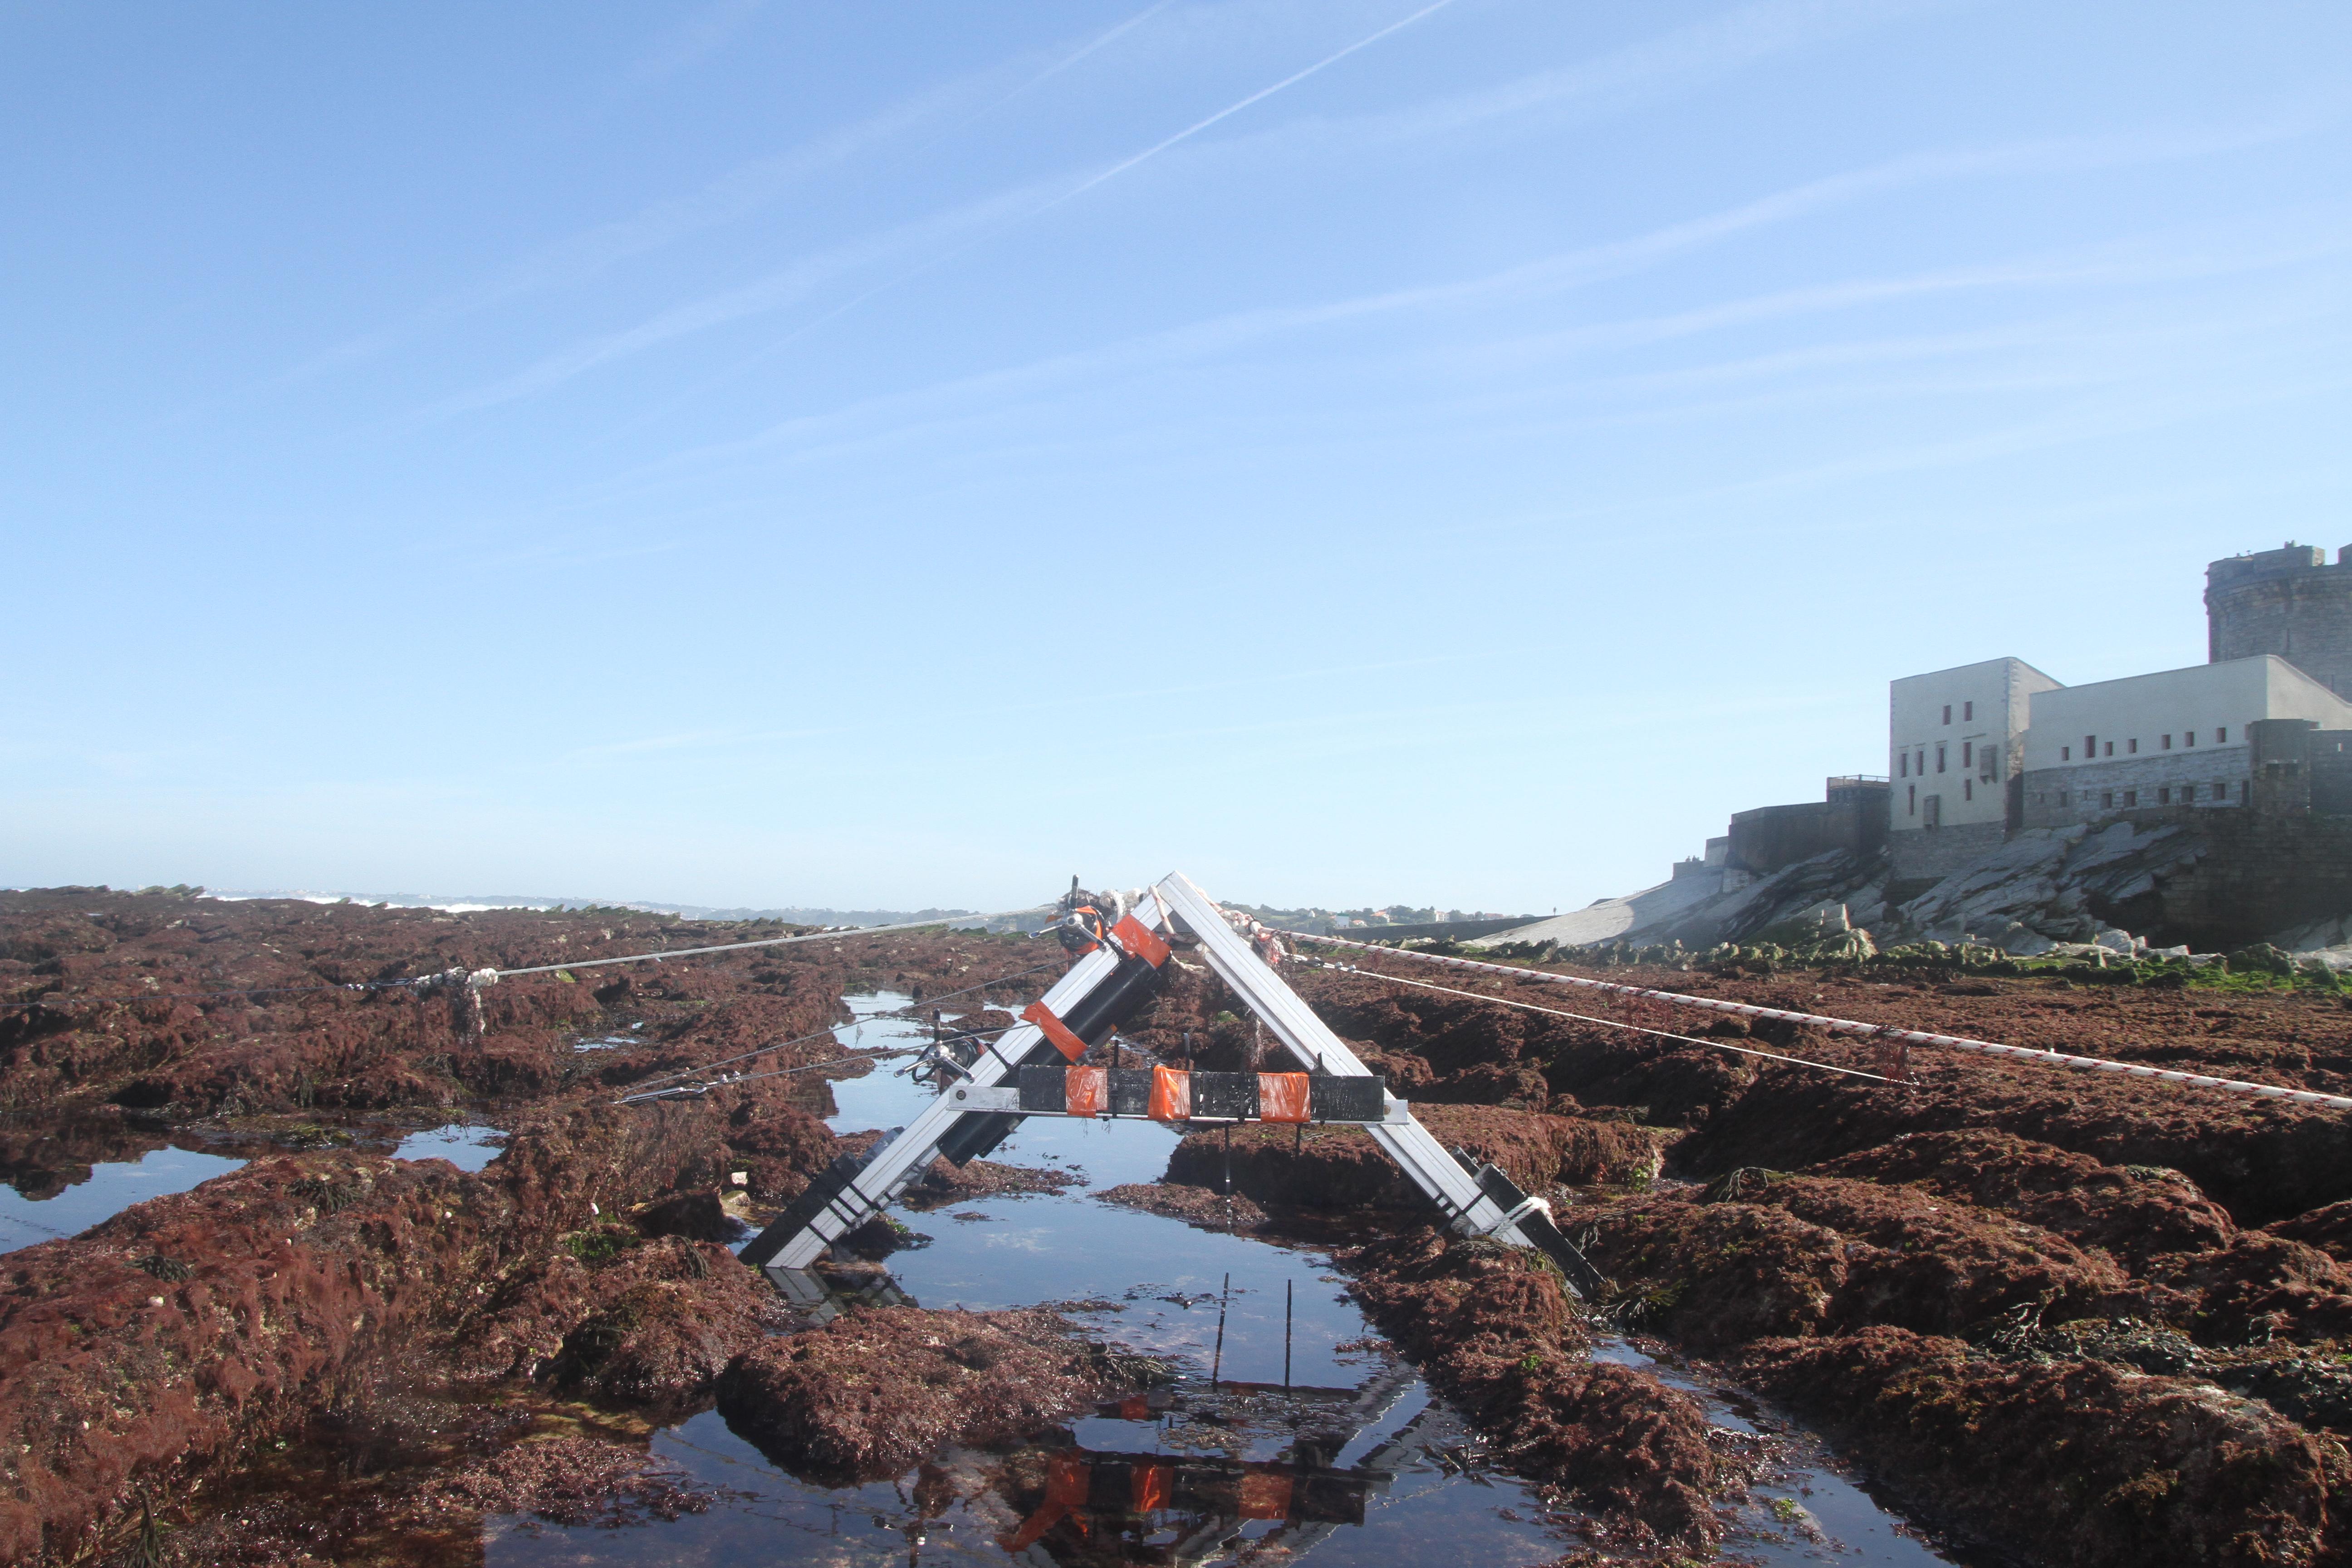
The database displays the field measurements recover during a one-week experiment in October 2021 on the Socoa's rocky platform, France. The general objective of the study was to evaluate the momentum balance over the rocky platform, in particular to quantifiy the combined effect of high seabed roughness and waves on the coupling between circulation, wave force and mean water level. The analysis is performed along a single cross-shore transect. The data include: - the cross-shore bathymetric profile - the time-series of integrated wave parameters, local mean water depth and wave-averaged currents over successive 30-min bursts - the depth- and wave-averaged momentum fluxes following the formulation proposed by Smith 2006 and Bruneau et al. 2011. The fluxes are median values obtained over significant wave height to depth ratio bins
-
Multibeam bathymetry and VHR seismic data acquired on the Lansdowne Bank, New Caledonia (SW Pacific)
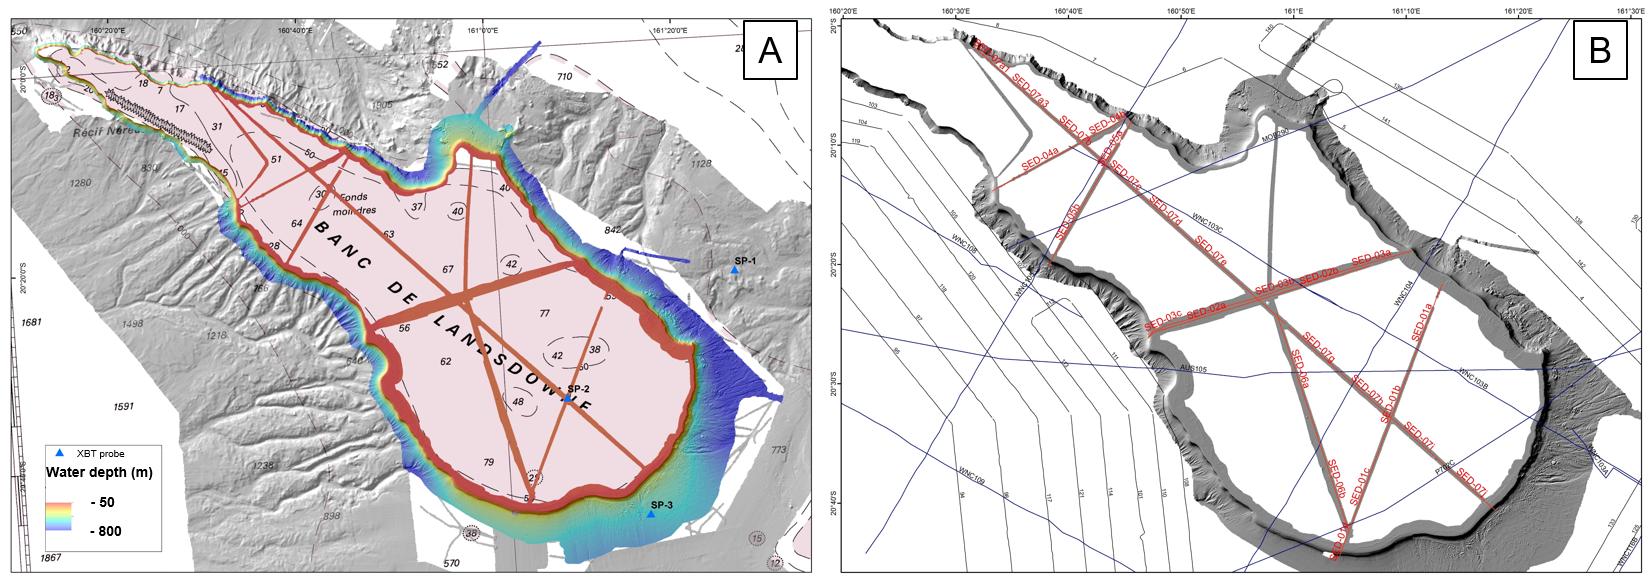
This dataset comprises multibeam bathymetry and very high resolution seismic data acquired over the Lansdowne Bank (New Caledonia, SW Pacific), during the SEDLAB cruise. The latter was a 29 day research cruise on the French national fleet ship R/V ALIS that took place in April and May 2018. The main aim was to characterise the sedimentary dynamics and the stratigraphic architecture of the Lansdowne Bank, a partly drowned, isolated rimmed carbonate platform of around 4000 km2 located offshore New Caledonia in the SW Pacific. More than 2000 km2 of new multibeam data, 7 single-channel SPARKER seismic profiles, along with 15 rock dredges and 8 sediment gravity cores were acquired on the bank top and adjacent slopes. These data reveal that the bank is typified by an almost continuous 4 km wide reef rim located in ca. 50 m water depth, showing typical “spurs and grooves” patterns. This outer rim surrounds a paleolagoon that gently deepens towards the inner platform, reaching up to 100 m water depth. Pinnacle reefs, up to 20 m high, are common close to the external reef rim, but are also scattered within the inner platform. Surprisingly, no obvious transfer axes across the reef rims, internal channels, tidal shoals or any clear current-related bedforms were imaged on the bank top. The bank is bordered by very steep slopes showing numerous bypass features such as canyons, channels and gullies. Additionally, spectacular bank margin collapses were identified. They are evidenced by up to 10 km wide intraslope and bank edge failure scarps, resulting in a scalloped geometry of the bank margin. Scarps are associated with km-sized blocks at the base-of-slope. Integration of all surface and subsurface data, together with post-cruise sedimentological, biostratigraphic and radiometric analyses on rock and sediment samples will hopefully bring new insight into the onset, aggradation and drowning history of the platform in relation to past sea-level changes and vertical tectonic movements. We believe that such results are relevant for the understanding of carbonate slope processes as well as platform-to-basin sediment budgets.
-
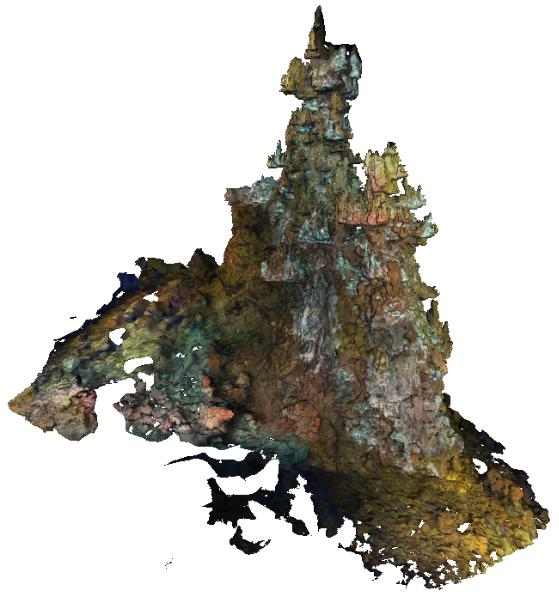
The Capelinhos hydrothermal vent site is a large edifice of 588 m² from its base. Located off axis, 1.5 km east of the central lava lake of the main Lucky Strike Hydrothermal Vent Field (mLSHVF), it is characterised by distinct geochemical and thermal conditions from the others mLSHVF edifices, with notably high iron concentrations compared to sites around the lava lake. The edifice has been surveyed with the remotely operated vehicle Victor6000 for inter-annual monitoring during the 2023 Momarsat cruise. Video transects were collected during dive 844-6 with a forward-looking camera and video sequences were used to build 3D models of the edifice using structure-from-motion techniques. A first dataset includes 2971 images extracted every 2 seconds from the videos. The images are time-stamped and linked to a navigation file, which is generated by interpolating navigation data at the corresponding timestamps. A second dataset includes a 3D textured model of the site (obj format) together with the a kml file for georeferencing. The ROV navigation file (.txt) is provided separately. Point : 37.28948183 (lat) -32.26413676 (long) -1663.487 (depth)
-

The data was collected during the survey NOMADS 09 (2009) conducted by the SHOM on the R/V Laplace. The bathymetry of the shelf edge and upper slope of the Moroccan Western Rifan continental Margin offshore the Spartel Headland (South of Gulf of Cadiz)) higtlights a field of NS trending kilometer-scale bathymetric ridges with elevation reaching more than 20m above surrounding seabed.
-

The Sintra hydrothermal vent site reconstructed in this dataset is 311.82 m². It is located in the North east of the main Lucky Strike Hydrothermal Vent Field (LSHF). The edifice has been surveyed with the remotely operated vehicle Victor6000 for inter-annual monitoring during the 2023 Momarsat cruise. Video transects were collected during dive 844-6 with a forward-looking camera and video sequences were used to build a 3D model of the edifice using structure-from-motion techniques. A first dataset includes 1561 images extracted every 2 seconds from the videos. The images are time-stamped and linked to a navigation file, which is generated by interpolating navigation data at the corresponding timestamps. A second dataset includes a 3D textured model of the site (obj format) together with the a kml file for georeferencing. The ROV navigation file (.txt) is provided separately. Point : 37.2921244612 (lat) -32.2750499167 (long) -1612.34 (depth)
-
Ages obtained through the 40Ar/39Ar method for basalt samples with the Nautile submersible along the axis of the Mid-Atlantic Ridge south of the Romanche transform fault. Major elements measurements were performed on the same samples. For a complete description of the method and discussion of results, please refer to the Grenet et al. 2023 article.
-
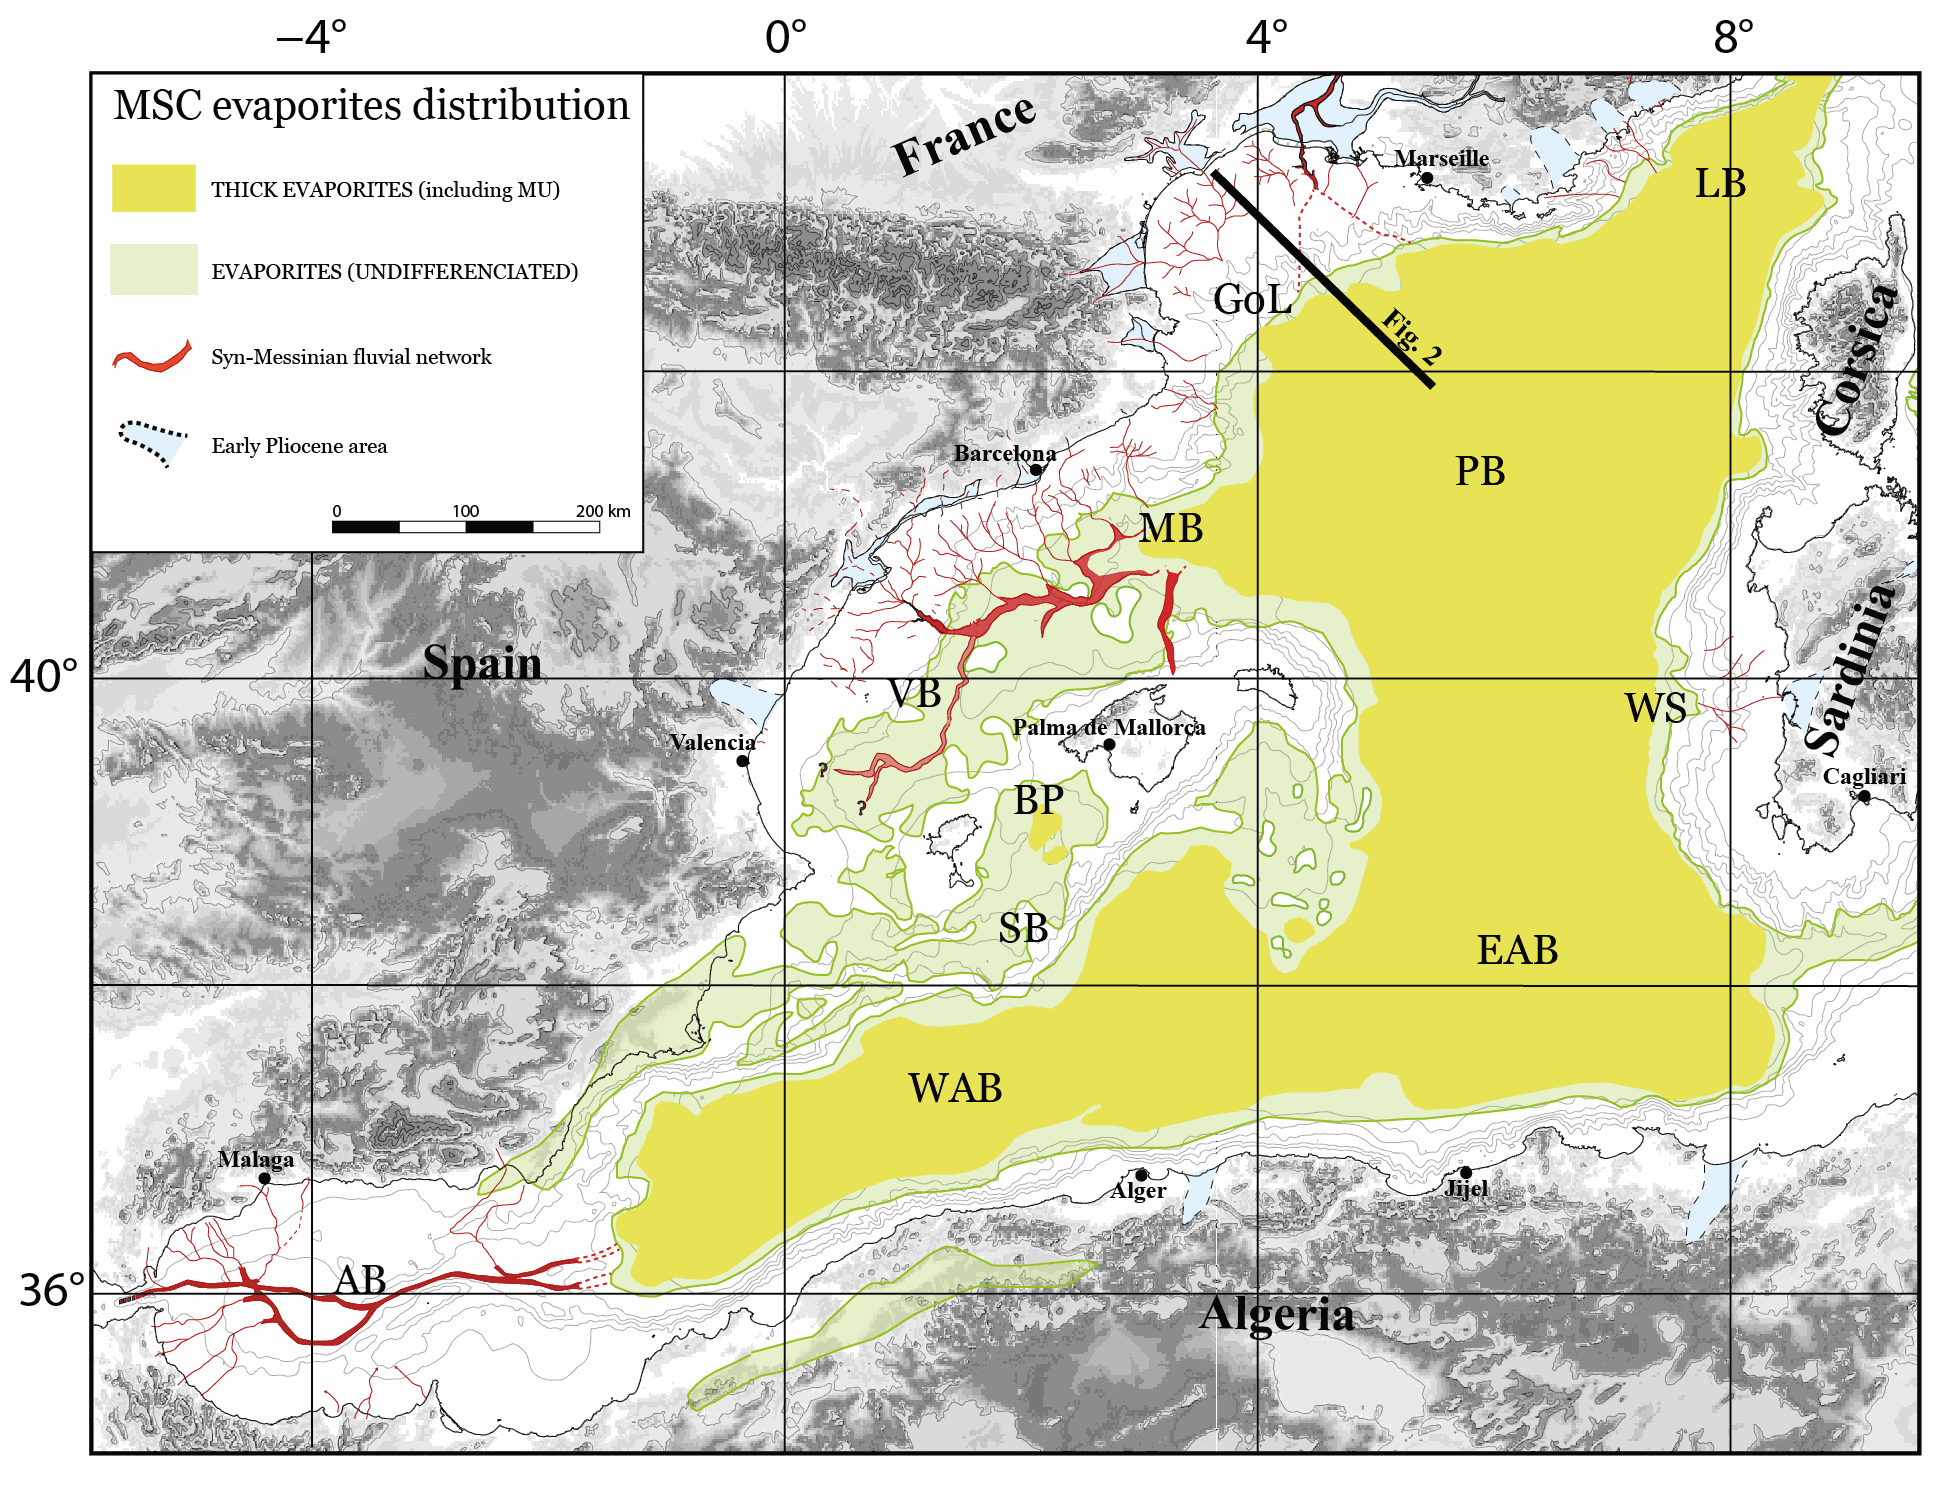
The Western Mediterranean Sea is a natural laboratory to address questions about the formation and evolution of continental margins and the relationship between surface and deep processes. The evaporites deposited during the late Miocene’s Messinian Salinity Crisis (MSC) strongly impact its sedimentological and geomorphological evolution. Hereafter, we present a compilation of some of the main regional seismic stratigraphic markers throughout the Western Mediterranean Sea. We provide in xyz format (z in second twt) the original, not interpolated, points interpretation of the following horizons: i) Acoustic basement, ii) Base and Top of the MSC salt, also known as Mobile Unit (MU), iii) base Pliocene and iv) Seafloor. The available reflection seismic dataset, coming from a collaboration between French, Spanish, Algerian and Italian research institutes, covers most of the Western Mediterranean sub-basins with the exception of the Ligurian Basin. This compilation is currently the most comprehensive and updated available in literature and provides a useful contribution to the scientific community working in sedimentary, tectonics and geodynamics studies in the Western Mediterranean Sea.
-
Processed high resolution bathymetry acquired during the SERPENTINE, 2007 cruise of RV Pourquoi Pas?

High-resolution bathymetry data were acquired over three areas of the Mid-Atlantic Ridge, during three dives of ROV Victor 6000 SERPENTINE cruise onboard RV Pourquoi Pas?, using a RESON 7125 echosounder mounted on the ROV frame, with an operating frequencyof 400 kHz, a beam opening angle of 120°, a velocity of ~0.3 m/s, maintaining an altitude ~50 m above the seafloor and using ultra-short baseline ROV positioning. Data processing was conducted with the Caraibes 5.0 software (@Ifremer). The processed grids have a grid spacing of 0.5 m (Krasnov area), or 1m (Logatchev and Ashadze areas).