 Metadata catalogue
500000
Type of resources
Available actions
Topics
INSPIRE themes
Keywords
Contact for the resource
Provided by
Years
Formats
Representation types
Update frequencies
status
Scale
Resolution
-
The GEOCR500 dataset was processed completely digitally in ArcGIS 9.1 and integrated within a regional geographic information system.
-
Magnetic map (K. Šalanský, 1995) of the Czech Republic in a scale 1 : 500,000 (GEOCR500) in the izanomal T (Z) form. Selected basic interval of isolines of 25 n T represents sufficiently accurately the course of the magnetic field. The map si complemented by the list of reports where are noticed basis which were used for the preparation of magnetic maps. The map is complemented by the selection of literature for interpretation of magnetic anomalies.
-

The trough geomorphic feature layer represents the spatial extent of the troughs of the Azores region, based on the SRTM30 plus v7 data.
-

This layer provides geographic information related to the ground elevation in the Azores, based on the SRTM30 plus v7 data.
-
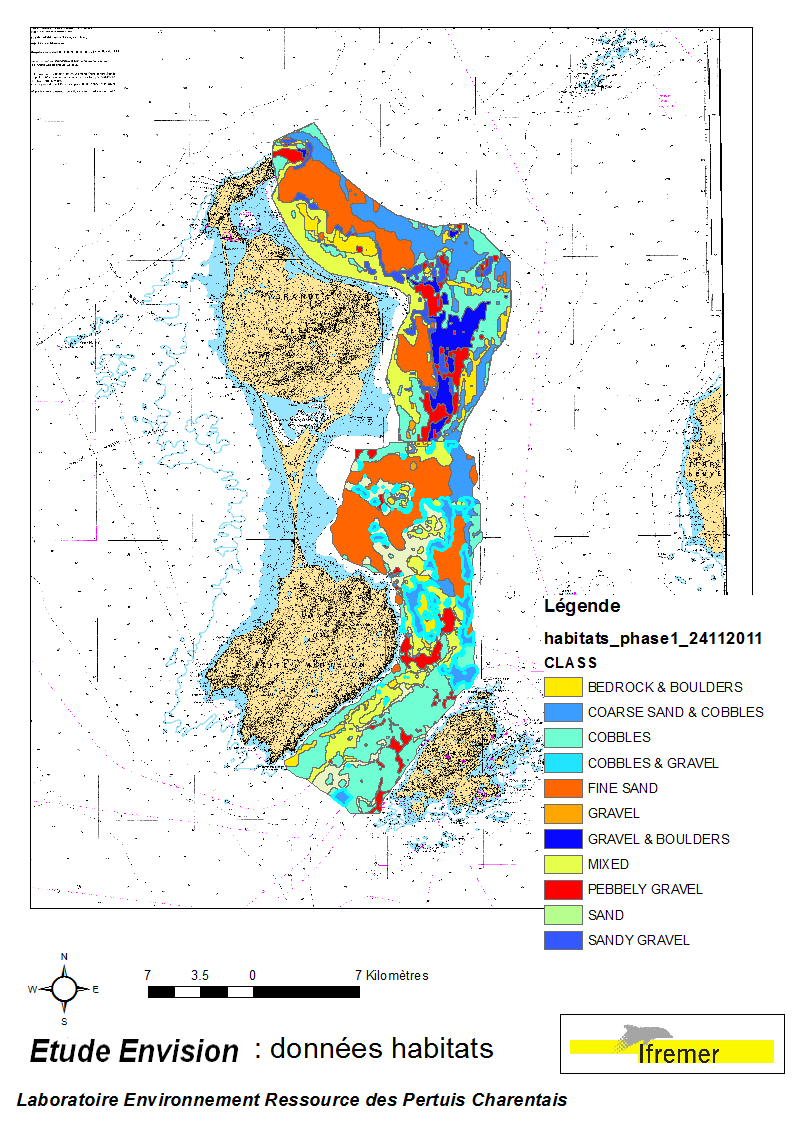
These data were collected during the 2007 and 2011 ENVISION-Ifremer campaigns to sustain a R & D project focusing on the Pectinid aquaculture development. This project was co-funded by the Saint Pierre et Miquelon public body and ODEADOM. This work aims to assess and select new potential rearing areas for the King scallop Placopecten magellanicus by using bottom type data resulting from 2 mapping campaigns carried out in 2007 and 2011 on the Eastern coast of Saint Pierre et Miquelon archipelago.
-
The difference in groundwater levels calculated by the hydrodynamic model in m between 2071-2100 and 1975-2004; RCA4/CNRM-CM5/RCP8.5 climate model. Simulated by a 2000 m by 2000 m grid, resolution: 1000 m by 1000 m grid. Unit: Meters. In the frame of NATeR - NAGIS, https://map.mbfsz.gov.hu
-

A set of 8 map sheets: 1. Carte 1 : l'eau, 1980 -1990. Scale of 1:500 000. Date of publication: 1994. 2. Carte 2 : croquis morpho-pédologique. Scale of 1:500 000. Date of publication: 1994. 3. Carte 3 : répartition de la population recensée, 1987. Scale of 1:500 000. Date of publication: 1994. 4. Carte 4 : les pêcheurs et la pêche. Scale of 1:500 000. Date of publication: 1994. 5. Carte 5 : emprise agricole et pastorale. Scale of 1:500 000. Date of publication: 1994. 6. Carte 6 : communications et marchés. Scale of 1:500 000. Date of publication: 1994. 7. Carte 7 : l'histoire du peuplement et la structuration du delta. Scale of 1:500 000. Date of publication: 1994. 8. Carte 8 : les changements dans le delta central. Scale of 1:500 000. Date of publication: 1994.
-

One mosaic of 4 map sheets: 1. Carte bathymétrique de la région de la Nouvelle-Calédonie. Scale of 1:500 000. Date of publication: 1989. 2. Carte bathymétrique de la région du grand lagon Nord de la Nouvelle-Calédonie et des récifs d'Entrecasteaux. Scale of 1:500 000. Date of publication: 1988. 3. Carte bathymétrique de la région sud-est de la Nouvelle-Calédonie. Scale of 1:500 000. Date of publication: 1989. 4. Carte bathymétrique du plateau des Chesterfields. Scale of 1:500 000. Date of publication: 1987.
-
The Bouguer anomaly is defined as the difference between the gravity measured at a specific point on the Earth’s surface and a gravity value calculated at the same point assuming that the Earth’s crust is homogeneous. This map shows both the regional negative anomalies associated with the Alps and the positive anomaly of the Sesia–Finero zone that signifies an excess of mass at depth.
-
Gravimetric map (J. Sedlák, Geofyzika, a.s., 1998) was published in Atlas of maps of the Czech Republic GEOČR500 in 1998 by CGS. It contains a raster image of gravimetric field. Map was created on the basis of measurements of 283 718 detailed points of gravity.