 Metadata catalogue
SHP
Type of resources
Available actions
Topics
INSPIRE themes
Keywords
Contact for the resource
Provided by
Years
Formats
Representation types
Update frequencies
status
Service types
Scale
Resolution
-
The approach to the affection of the submarine noise in the North Atlantic Marine Subdivision has been made for a 5' x 5' grid, being the noise source navigation. To do this, a semi-quantitative index has been developed that integrates the analysis of AIS data (merchant vessels) and VMS data (fishing ships). For both, cells have been selected according to the intensity of traffic effects based on the density of AIS and VMS signals in a month. In both cases, different intensity intervals have been established, and each case has been given a different weight. In addition, adjacent cells have been selected (classified into four ranges), giving them another way of importance depending on the proximity. The zero range coincides with the cells in which the signal density was recorded, while the first range corresponds to those cells limiting with the zero level, and so on. In Table 10 and Table 11 of the aforementioned document the applied values are indicated. The final result is the addition of all the weights in each cell, taking into account the maximum value for the bordering cells. The values range between 0 and 3.1, with the following levels of classification: Very High: > 2 / High: 1.71 - 2 / Medium: 0.41 - 1.7 / Low: 0.1 - 0, 4 / Very Low < 0.1
-
The digital geological map of Greece at 1:1million scale is composed of layers of polygonal objects depicting stratigraphic units and lines depicting faults. It has been created - in the frame of the One Geology Europe Plus project - from the 1:50 000 scale map sheets, using the One Geology Europe vocabulary terms to describe lithology & age of formations.
-
Administrative divisions of Aringa, Madi, Madi-Okollo, and Terego County as of December 2001, Uganda

The shapefile represents the administrative divisions of Aringa, Madi, Madi-Okollo, and Terego County of Arua district in the North of Uganda as of December 2001. The shapefile subdivides the counties into 7 subcounties. These, in turn have 41 subdivisions that are called parishes. The parishes are further subdivided into 345 villages. We digitized the administrative units from paper maps that we have received from Uganda Bureau of Statistics in Entebbe. The associated population size on village level represents the provisional result of the Uganda census 2002.
-

The shapefile represents the administrative divisions of Adjumani district in the North of Uganda as of December 2001. The shapefile divides Adjumani district into 1 county. The county is subdivided into 5 subcounties and one town council. These, in turn have 15 subdivisions that are called parishes. The parishes are further subdivided into 73 villages. We digitized the administrative units from paper maps that we have received from Uganda Bureau of Statistics in Entebbe. The associated population size on village level represents the provisional result of the Uganda census 2002.
-
The Bouguer anomaly is defined as the difference between the gravity measured at a specific point on the Earth’s surface and a gravity value calculated at the same point assuming that the Earth’s crust is homogeneous. This map shows both the regional negative anomalies associated with the Alps and the positive anomaly of the Sesia–Finero zone that signifies an excess of mass at depth.
-
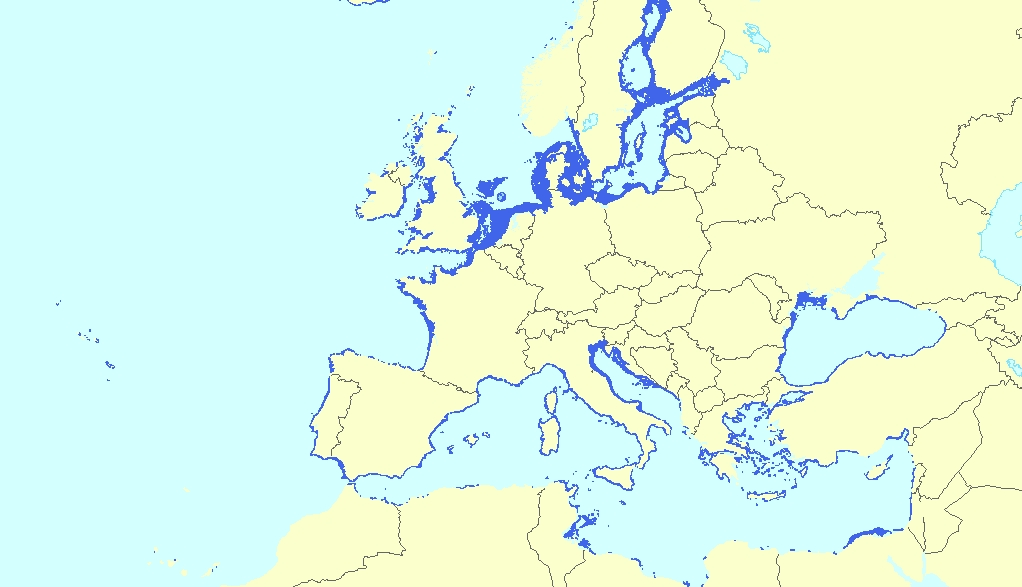
This vector dataset represents the benthic broad habitat types in Europe Seas potentially affected by the ship wakes. When navigating, the propellers of ships generate a turbulent mixing of the water that can produce sediment re-suspension in soft bottoms of shallow areas. This can increase the turbidity in those areas, affecting the seafloor organisms (especially those that are directly dependent on light, such as aquatic plants). It may also contribute to an increase of the the eutrophication level of the ecosystem (since the turbid waters may become warmer, which may turn into a reduction of dissolved oxygen in water). Finally, turbidity can produce an increase in the inputs of contaminants and microbial pathogens, since those can become attached to the suspended solids. The dataset has been prepared in the context of the development of the first European Maritime Transport Environmental Report (https://www.eea.europa.eu/publications/maritime-transport).
-
-
The present database is composed of a polygon shape file (.shp) dedicated to GIS applications. This seafloor surface represents the area within which (sub-)outcropping methane derived authigenic carbonates were identified based on ship-borne multibeam bathymetry and seafloor backscatter data; as displayed in Figs. 4 and S1a of Dupré et al. 2020 (Dupré S, Loubrieu B, Pierre C, Scalabrin C, Guérin C, Ehrhold A, Ogor A, Gautier E, Ruffine L, Biville R, Saout J, Breton C, Floodpage J, Lescanne M (2020) The Aquitaine Shelf Edge (Bay of Biscay): A Primary Outlet for Microbial Methane Release. Geophysical Research Letters 47 (7):e2019GL084561. doi:10.1029/2019gl084561). The presence of (sub-)outcropping methane-derived authigenic carbonates at the seafloor was confirmed by remotely-operated-vehicle dives during the GAZCOGNE2 marine expedition. The acoustic data were acquired in 2013 on board the R/V Le Suroît during the GAZCOGNE1 expedition with two ship-borne multibeam echosounders, the Kongsberg EM302 and EM2040, with transmission frequency of 30 and 200 kHz, respectively. Details on multibeam data acquisition, processing and interpretation of sub-outcropping methane-derived authigenic carbonate structures are presented in Dupré et al 2020 (including a Supporting Information section). Cited from Dupré et al 2020: “The carbonates are exclusively located along the shelf edge with the majority (98%) between 140 and 220 m water depths. The (sub-)outcropping carbonates are spread over a 375 km2 area that extends over a distance of 80 km between the Cap Ferret and Capbreton canyons. The western spatial limit of the methane-derived authigenic carbonates coincides with the shelf break.”
-
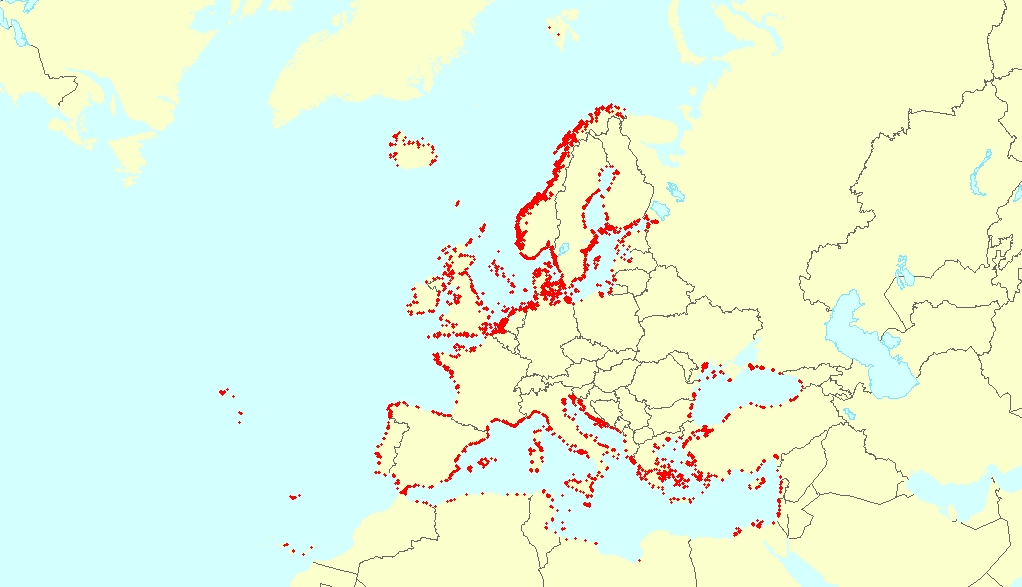
This vector dataset represents the benthic broad habitat types in Europe seas potentially affected by anchoring. The anchoring of vessels can produce damages to the seafloor and the loss of the habitat where it happens. It takes place in shallow waters, close to ports, where vessels have to wait for a spot in the port so they can load or offload (since ports have a limited amount of dockage). The anchoring areas allow vessels to safely anchor in protection from bad weather or other circumstances. The type of alterations to the habitats resulting from anchoring depend mainly on the dimensions and type of the anchor, as well as its movement resulting from the movement of the vessel due to currents or waves, which can increase the adverse effects. The dataset has been prepared in the context of the development of the first European Maritime Transport Environmental Report (to be published as an EMSA-EEA report in 2021).
-
The approach to the affection of the submarine noise in the Levantine-Balear Subdivision has been made for a 5' x 5' grid, being the noise source navigation. To do this, a semi-quantitative index has been developed that integrates the analysis of AIS data (merchant vessels) and VMS data (fishing ships). For both, cells have been categorized according to the traffic intensity based on the density of AIS and VMS signals in a month. In both cases, different intensity intervals have been established, and different cases have been given different weights. In addition, adjacent cells have been selected (classified into four ranges), giving them another way of importance depending on the proximity. The zero range coincides with the cells in which the signal density was recorded, while the first range corresponds to those cells limiting with the zero level, and so on. The final result is the addition of all the weights in each cell, taking into account the maximum value for the bordering cells. The values range between 0 and 3.1, with the following levels of classification: Very High:> 2 / High: 1.71 - 2 / Medium: 0.41 - 1.7 / Low: 0.1 - 0, 4 / Very Low < 0.1