 Metadata catalogue
British Oceanographic Data Centre
Type of resources
Available actions
Topics
INSPIRE themes
Keywords
Contact for the resource
Provided by
Years
Formats
Representation types
Update frequencies
Scale
Resolution
-
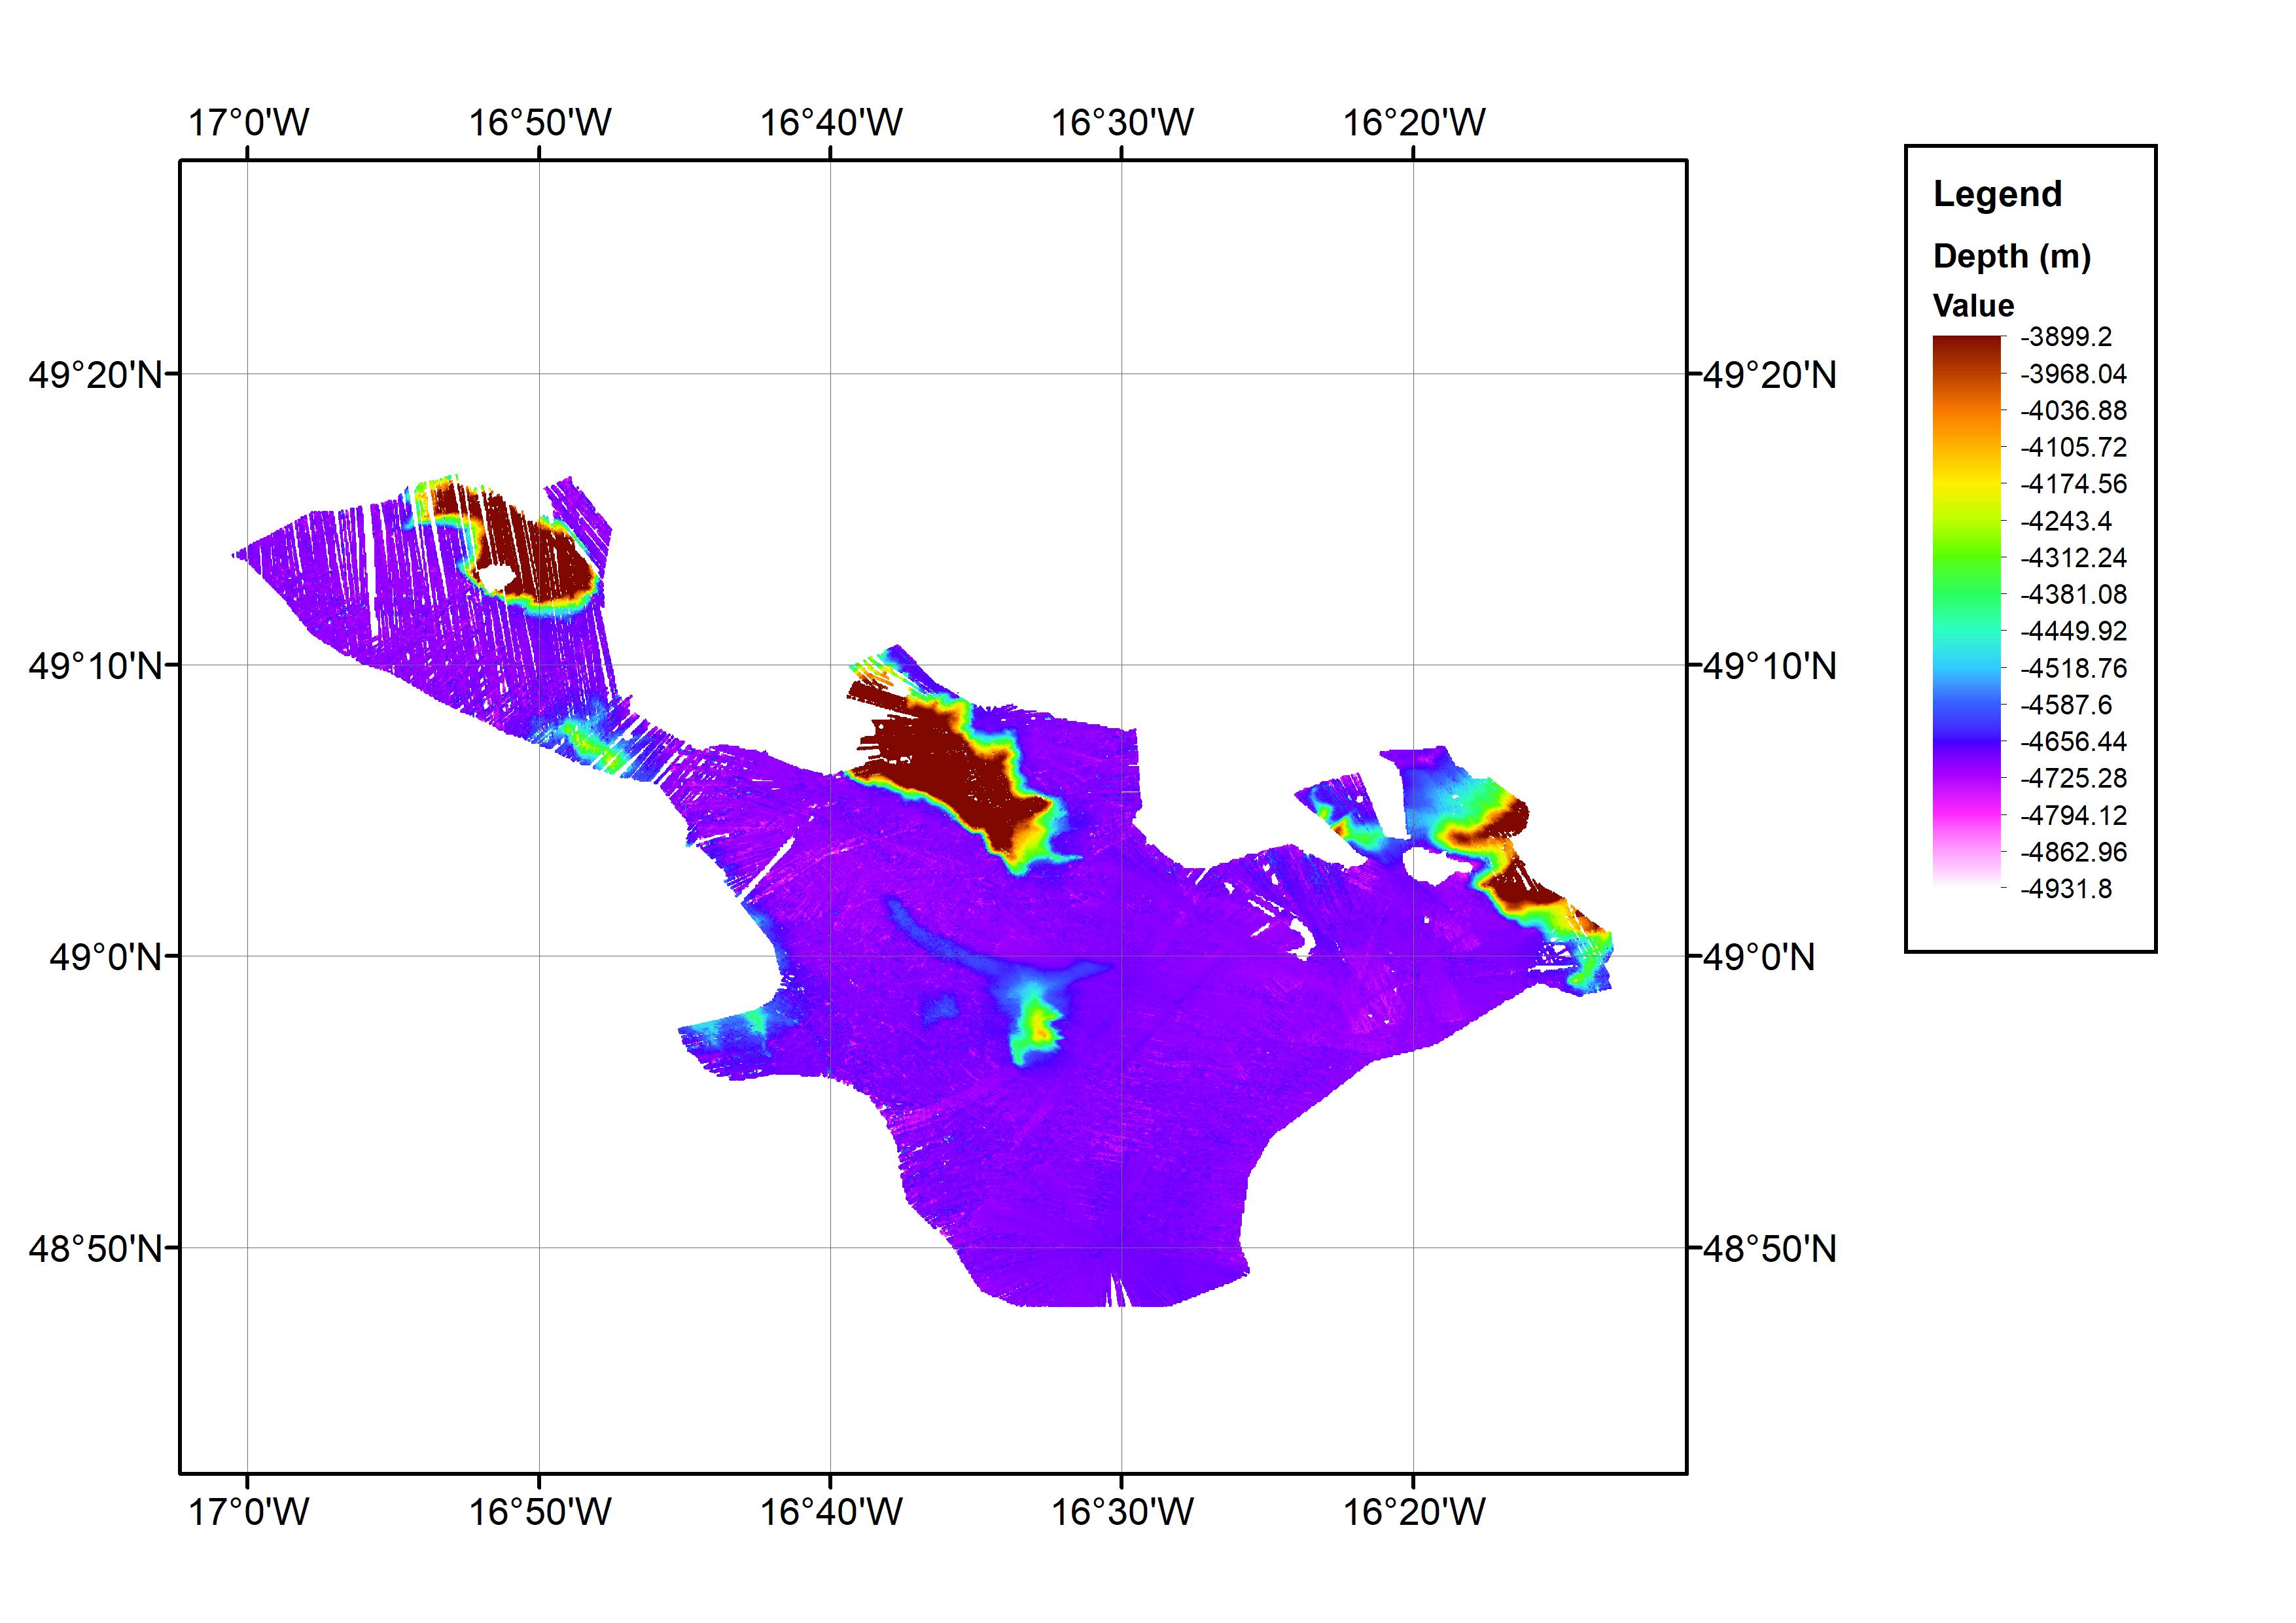
This data set consists of a bathymetric grid derived from multibeam bathymetry data from cruise JC071. The bathymetric grid was created by gridding cleaned raw multibeam data from JC071 at 1/64 arc-minute intervals. The data set covers an approximate one degree square with the minimum and maximum longitude and latitude co-ordinates: 17.016667W-16.216667W; 48.78333N-49.28333N. This is located in the Northeast Atlantic Ocean area. The data were collected from 7th-8th May 2012 using an EM120 Multibeam Echo-sounder. The cruise was part of the Porcupine Abyssal Plain (PAP): sustained ocean observation project. The bathymetry data were collected on an opportunistic basis during the cruise. The cruise was operated by the National Oceanography Centre (NOC), equipment operated by National Marine Facilities Sea Systems. The bathymetric grid was created by BODC for contributing to the EMODnet HRSM Project.
-
9496-25-DTM - Site Survey of Dogger Bank Tranche C Offshore Wind Farm Area by Gardline Geosurvey Ltd
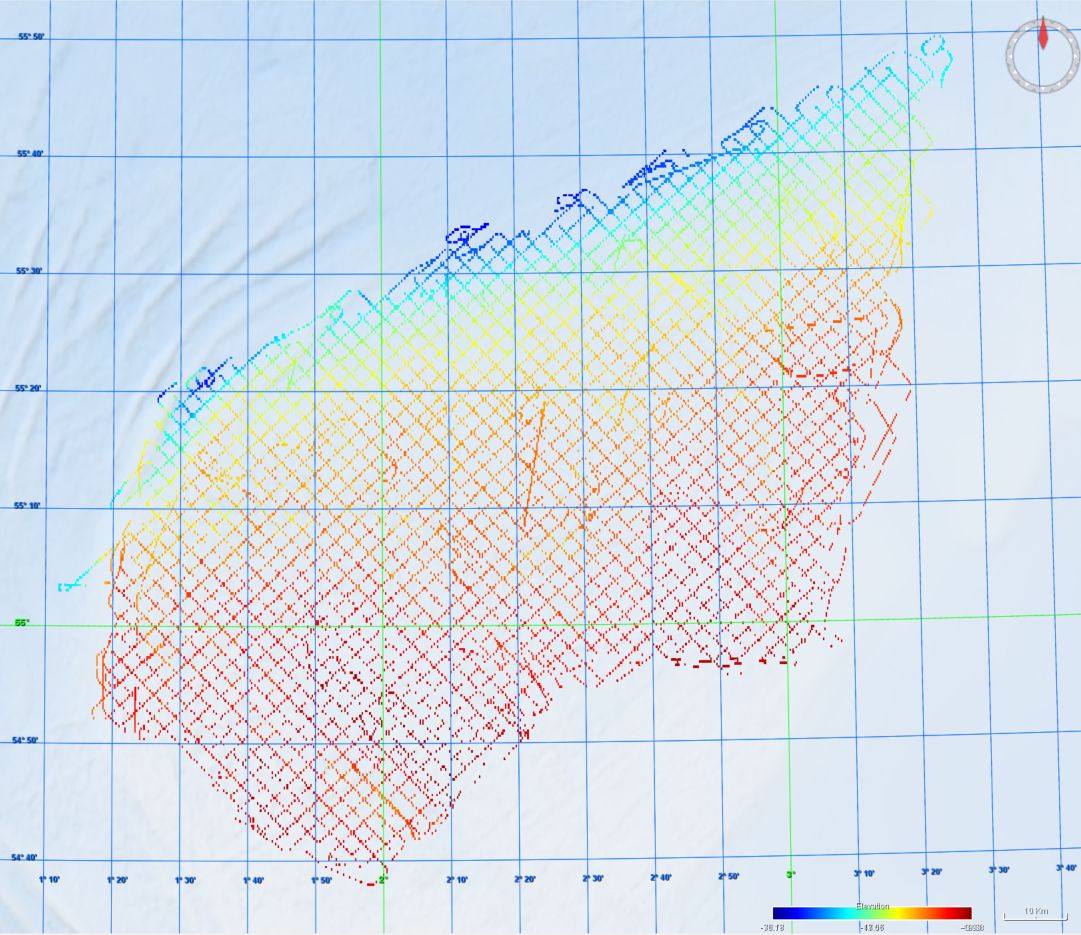
Gardline Geosurvey Limited was contracted to survey the Dogger Bank Offshore Wind Farm (OWF) Area between 04-Apr-2013 and 02-Aug-2013, comprising the Tranche C zonal surveys. The aim of the surveys was to carry out a geophysical investigation that would broadly assess the entire developable area of the zone. Seabed information was required to inform the site selection process and enable preliminary foundation design to be undertaken. The geological data acquisition programme was carried out on M.V. Sea Surveyor, which sailed from Hull and returned to Blyth, and M.V. Vigilant which sailed from, and returned to, Great Yarmouth upon completion of survey operations. The Crown Estate is the data owner and copyright holder.
-
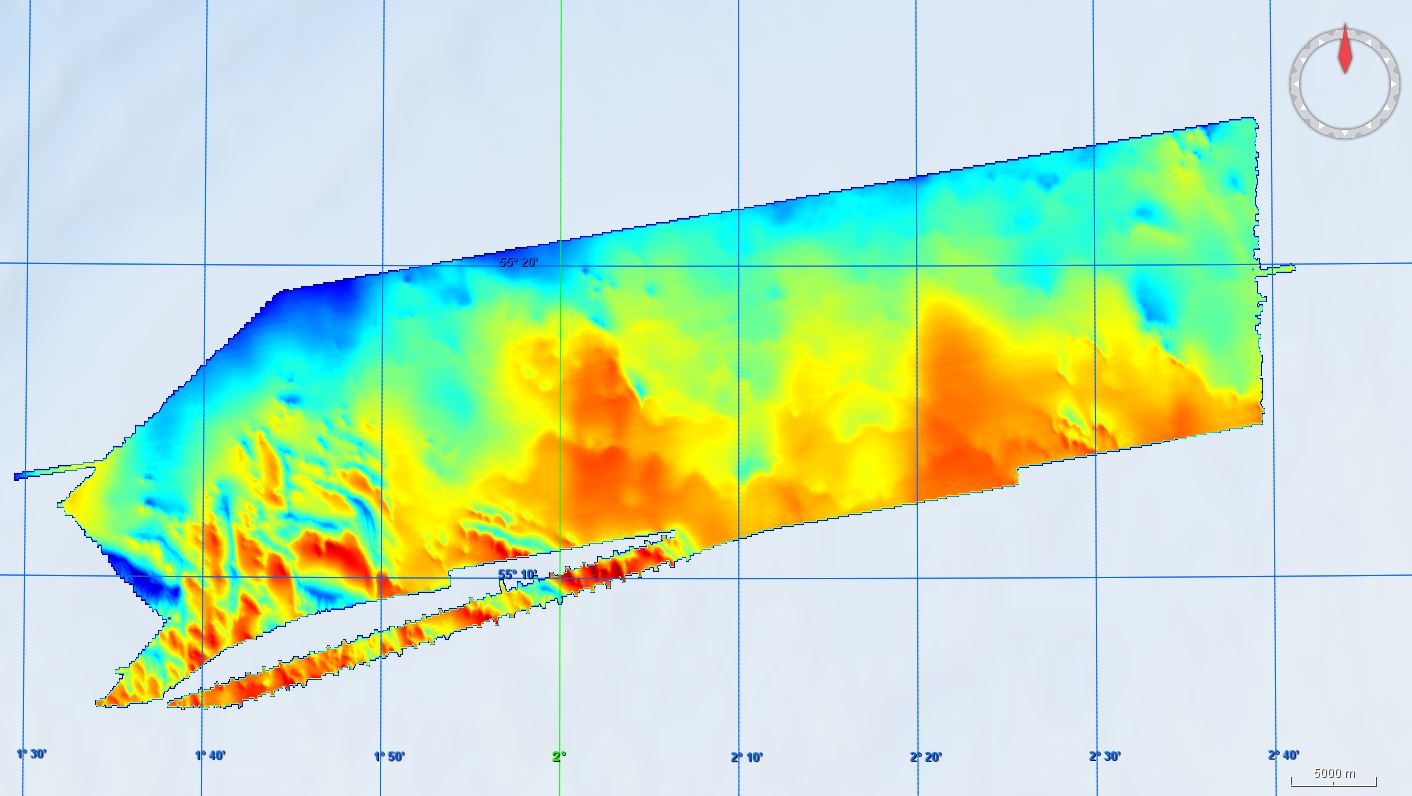
GEMS Survey Ltd. (GEMS) were contracted by Forewind Limited to undertake a bathymetric and geophysical survey of the Tranche A development area and two met mast locations (which were later revised) within the Dogger Bank Zone, in addition to a cable reconnaissance from Tranche A to the Yorkshire coastline. The primary objectives of the survey were to produce sufficiently high resolution bathymetric and geophysical data and interpretations to allow regional interpretation for planning and modelling purposes; for met mast design to commence and to provide high quality data to inform further benthic and environmental surveys. This survey was carried out between 8 July 2010 and 26 December 2010. The vertical datum for this project is LAT using predicted tides. This metadata relates to the bathymetric datasets. The surveys were undertaken onboard the MV Aquarius and MV Kommandor Jack.
-
-
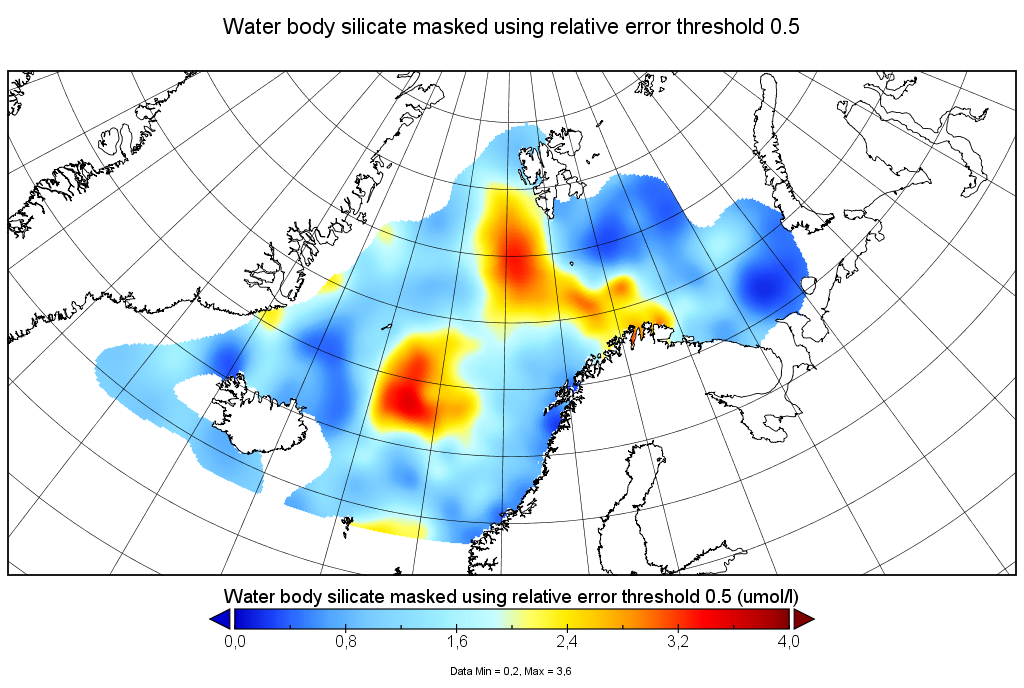
Moving 6-year analysis of Water body silicate in the Arctic Ocean, for each season in the period 1965-2017. Every year of the time dimension corresponds to the 6-year centered average for each season. Winter: December-February, Spring: March-May, Summer: June-August, Autumn: September-November. Depth range (IODE standard depths): 0, 5, 10, 20, 30, 40, 50, 75, 100, 125, 150, 200, 250, 300, 400, ..., 1500, 1750, 2000, 2500m. Units: umol/l. Description of DIVA analysis: The computation was done with the DIVAnd (Data-Interpolating Variational Analysis in n dimensions), version 2.6.6, using GEBCO 30sec topography for the spatial connectivity of water masses. The horizontal resolution of the produced DIVAnd maps grids is 0.1 degrees. Signal-to-noise ratio was fixed to 2.0, horizontal correlation length to 100 km, and vertical correlation length varying between 25 and 200 m. Logarithmic transformation is applied to the data prior to the analysis. Background field: the data mean value is subtracted from the data.
-
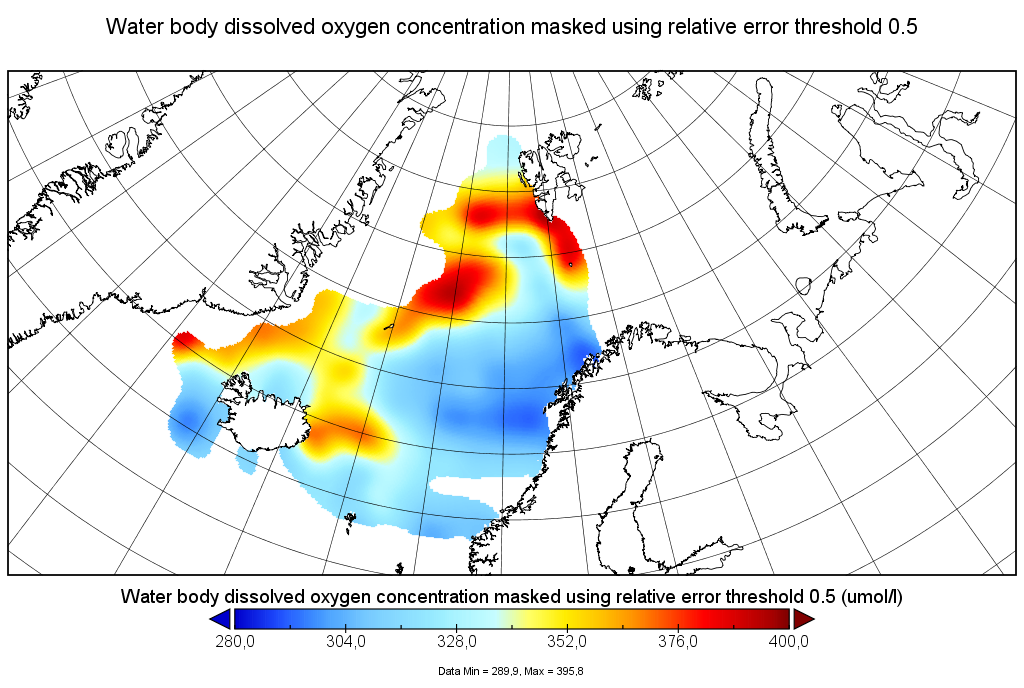
Moving 6-year analysis of Water body dissolved oxygen concentration in the Arctic Ocean, for each season in the period 1965-2017. Every year of the time dimension corresponds to the 6-year centered average for each season. Winter: December-February, Spring: March-May, Summer: June-August, Autumn: September-November. Depth range (IODE standard depths): 0, 5, 10, 20, 30, 40, 50, 75, 100, 125, 150, 200, 250, 300, 400, ..., 1500, 1750, 2000, 2500m. Units: umol/l. Description of DIVA analysis: The computation was done with the DIVAnd (Data-Interpolating Variational Analysis in n dimensions), version 2.6.6, using GEBCO 30sec topography for the spatial connectivity of water masses. The horizontal resolution of the produced DIVAnd maps grids is 0.1 degrees. Signal-to-noise ratio was fixed to 2.0, horizontal correlation length to 100 km, and vertical correlation length varying between 25 and 200 m. Logarithmic transformation is applied to the data prior to the analysis. Background field: the data mean value is subtracted from the data.
-
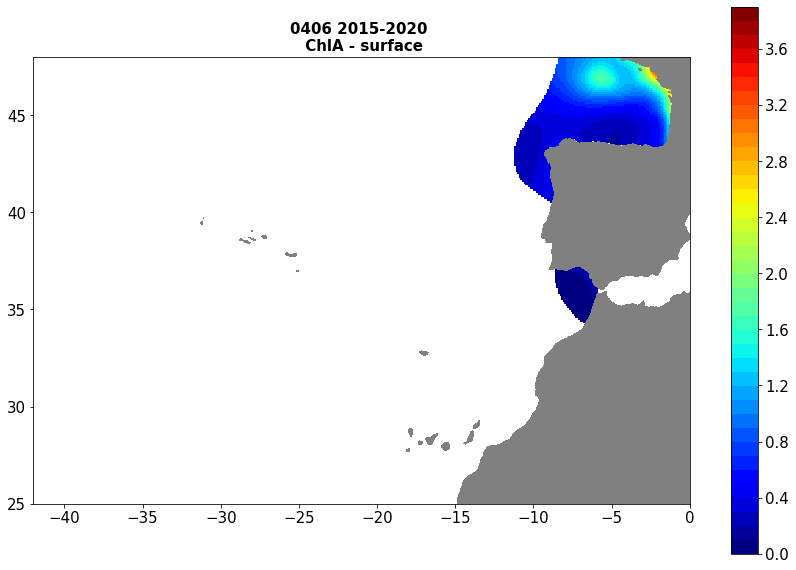
Moving 6-year analysis of Chlorophyll-a at Atlantic Sea for each season. - winter: January-March, - spring: April-June, - summer: July-September, - autumn: October-December Every year of the time dimension corresponds to the 6-year centred average of each season. 6-year periods span from 1972-1977 until 2012-2020. Observational data span from 1972 to 2020. Depth range (IODE standard depths): -300.0, -250.0, -200.0, -150.0, -125.0, -100.0, -75.0, -50.0,-40.0, -30.0, -20.0, -10.0, -5.0, -0.0 Data Sources: observational data from SeaDataNet/EMODNet Chemistry Data Network. Description of DIVA analysis: Geostatistical data analysis by DIVA (Data-Interpolating Variational Analysis) tool. GEBCO 1min topography is used for the contouring preparation. Analyzed filed masked using relative error threshold 0.3 and 0.5 DIVA settings. Correlation length was optimized and filtered vertically and a seasonally-averaged profile was used. Signal to noise ratio was fixed to 1. Logarithmic transformation applied to the data prior to the analysis. Background field: the data mean value is subtracted from the data. Detrending of data: no, Advection constraint applied: no. Units: mg/m^3
-
Moving 6-year analysis and visualization of Water body dissolved inorganic nitrogen (DIN ) in the North Sea, four seasons: winter (dec-feb), spring (mar-may), summer (jun-aug), autumn (sep-nov). Data Sources: observational data from SeaDataNet/EMODnet Chemistry Data Network. Description of DIVA analysis: Geostatistical data analysis by DIVAnd (Data-Interpolating Variational Analysis) tool, version 2.7.2. results were subjected to the minfield option in DIVAnd to avoid negative/underestimated values in the interpolated results; error threshold masks L1 (0.3) and L2 (0.5) are included as well as the unmasked field. The depth dimension allows visualizing the gridded field at various depths.
-
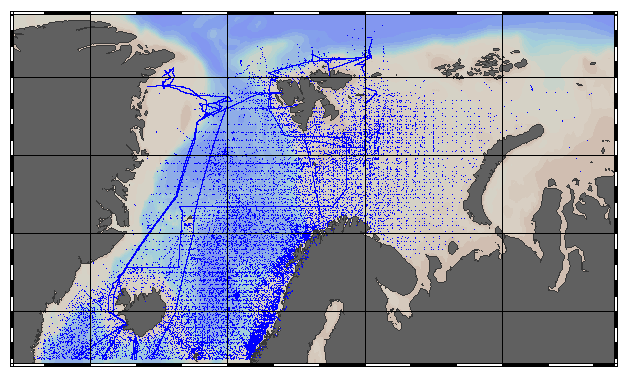
EMODnet Chemistry aims to provide access to marine chemistry data sets and derived data products concerning eutrophication, acidity and contaminants. The chemicals chosen reflect importance to the Marine Strategy Framework Directive (MSFD). This aggregated dataset contains all unrestricted EMODnet Chemistry data on Eutrophication and Acidity (14 parameters with quality flag indicators), and covers the Norwegian Sea, Barents Sea, Greenland Sea and Icelandic Waters with 114721 CDI stations. Data were aggregated and quality controlled by 'Institute of Marine Research - Norwegian Marine Data Centre (NMD)'. Regional datasets concerning eutrophication and acidity are automatically harvested and resulting collections are aggregated and quality controlled using ODV Software and following a common methodology for all Sea Regions ( https://doi.org/10.6092/9f75ad8a-ca32-4a72-bf69-167119b2cc12 ). When not present in original data, Water body nitrate plus nitrite was calculated by summing up the Nitrates and Nitrites. Same procedure was applied for Water body dissolved inorganic nitrogen (DIN) which was calculated by summing up the Nitrates, Nitrites and Ammonium. Parameter names are based on P35, EMODnet Chemistry aggregated parameter names vocabulary, which is available at: https://www.bodc.ac.uk/resources/vocabularies/vocabulary_search/P35/ Detailed documentation is available at: https://dx.doi.org/10.6092/4e85717a-a2c9-454d-ba0d-30b89f742713 Explore and extract data at: https://emodnet-chemistry.webodv.awi.de/eutrophication>Arctic The aggregated dataset can also be downloaded as ODV collection and spreadsheet, which is composed of metadata header followed by tab separated values. This spreadsheet can be imported to ODV Software for visualisation (More information can be found at: https://www.seadatanet.org/Software/ODV ) The original datasets can be searched and downloaded from EMODnet Chemistry Download Service: https://emodnet-chemistry.maris.nl/search
-
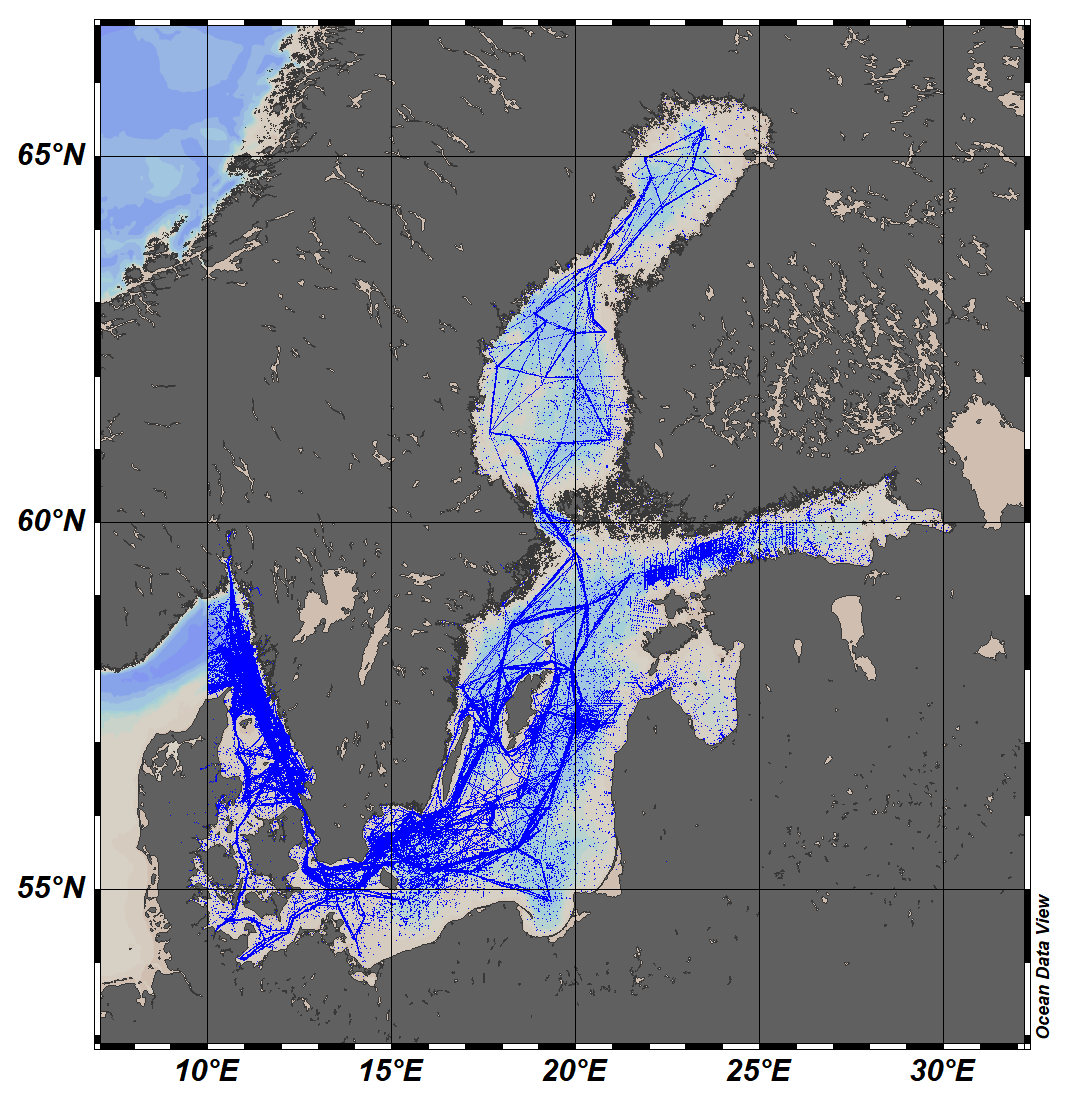
The SeaDataCloud Temperature and Salinity historical data collection for the Baltic Sea V2 includes open access in situ data on temperature and salinity of water column. The data were retrieved from the SeaDataNet infrastructure during summer 2019. Data have been quality controlled according to the SeaDataNet2 project QC procedures in conjunction with the visual expert check using the ODV software. The final number of stations in the collection is 481695, containing around 14.4 million values for both temperature and salinity. The dataset format is ODV binary collection which you can read, analyse and export from with the ODV application provided by the Alfred Wegener institute at http://odv.awi.de/. For data access please register at http://www.marine-id.org/.