 Metadata catalogue
Chlorophyll pigment concentrations in water bodies
Type of resources
Available actions
Topics
INSPIRE themes
Keywords
Contact for the resource
Provided by
Years
Formats
Representation types
Scale
Resolution
-

SYKE Alg@line project in the Baltic Sea monitors the state of the sea and detects algal blooms. Several millions of data points are collected annually from the Baltic Sea, using a fleet of 5-7 ferries. Two best equipped ferries offered in TNA are m/s Silja Serenade, which travels daily between Helsinki and Stockholm (Sweden) and m/s Finnmaid, which travels approx. twice a week from Helsinki to Travemünde (Germany) and back. Both ferries are equipped with flow-through system with thermosalinograph, chlorohyll, phycocyanin and CDOM fluorometers, turbiditymeter and refrigerated sampling unit providing discrete water samples for laboratory analyses (e.g. microscopy, flowCAM, nutrients, optical analysis, experimental work). Additional sensors e.g. for primary production (FRRF) and light reflectance are used periodically, new sensors for light absorption and pCO2 will be soon implemented. Data can be retrieved in real time using satellite or GSM connection (basic sensors) or downloaded during harbour visits (additional sensors). Alg@line data is available e.g. through MyOcean and has also been delivered to users based on mutual cooperation, including scientific advice. Algaline ships maintained by SYKE host measurement systems from other countries, and periodically they are used as platforms for international short-term studies.
-

The SOCIB Glider Facility is an example of new technologies being progressively implemented in coastal to open ocean regions allowing autonomous and sustained high-resolution monitoring of specific areas. SOCIB-GF is fully operational in JERICO-NEXT and since 2006 has accomplished 64 missions, 1.244 days in water, 14.555 nm navigated with 39.378 vertical profiles collected. SOCIB-GF human team is composed out of 2 full-time engineers, 1 full-time technician, 2 part-time field-technicians (for at sea operations), 2 part time engineers (for glider data management) and 2 part-time experienced scientists. An intense and fruitful collaboration with IMEDEA (CSIC-UIB) team also exists since the origin of glider operations. The fleet in 2016 consists of 7 Slocum gliders and 2 iRobot Seagliders, equipped for collecting both physical (T, S) and biogeochemical data (fluorescence, oxygen, etc.) at high spatial resolutions (2km). SOCIB-GF includes a pressure chamber (1.000 m) as well as ballasting and operations labs. It also has access to other SOCIB facilities such as (1) ETD (Engineering & Technology Development): Hurricane Zodiac 9.2 m RIB, Lab-Van and harbour warehouse; (2) SOCIB-R/V: a 24 m coastal catamaran and (3) Data Center: including data management, public repository, on-line web-based platform tracker -for mission monitoring- and development of tools such as the glider processing toolbox (Troupin et al., Methods in Oceanog., 2015, - freely available scripts available at https://github.com/socib/glider_toolbox).
-

SYKE Alg@line project in the Baltic Sea monitors the state of the sea and detects algal blooms. Several millions of data points are collected annually from the Baltic Sea, using a fleet of 5-7 ferries. Two best equipped ferries offered in TNA are m/s Silja Serenade, which travels daily between Helsinki and Stockholm (Sweden) and m/s Finnmaid, which travels approx. twice a week from Helsinki to Travemünde (Germany) and back. Both ferries are equipped with flow-through system with thermosalinograph, chlorohyll, phycocyanin and CDOM fluorometers, turbiditymeter and refrigerated.sampling unit providing discrete water samples for laboratory analyses (e.g. microscopy, flowCAM, nutrients, optical analysis, experimental work). Additional sensors e.g. for primary production (FRRF) and light reflectance are used periodically, new sensors for light absorption and pCO2 will be soon implemented. Data can be retrieved in real time using satellite or GSM connection (basic sensors) or downloaded during harbour visits (additional sensors). Alg@line data is available e.g. through MyOcean and has also been delivered to users based on mutual cooperation, including scientific advice. Algaline ships maintained by SYKE host measurement systems from other countries, and periodically they are used as platforms for international short-term studies.
-

Socib Glider
-
Socib Glider
-

Socib Glider
-
Moving 6-year analysis of Water_body_chlorophyll-a in the Mediterranean Sea for each season: - winter: January-March, - spring: April-June, - summer: July-September, - autumn: October-December. Every year of the time dimension corresponds to the 6-year centered average of the season. 6-years periods span from 1990-1995 until 2014-2019. Observational data span from 1970 to 2019. Depth range (IODE standard depths): -1000.0, -900.0, -800.0, -700.0, -600.0, -500.0, -400.0, -300.0, -250.0, -200.0, -150.0, -125.0, -100.0, -75.0, -50.0, -30.0, -20.0, -10.0, -5.0, -0.0. Data Sources: observational data from SeaDataNet/EMODnet Chemistry Data Network. Description of DIVA analysis: Geostatistical data analysis by DIVA (Data-Interpolating Variational Analysis) tool. Profiles were interpolated at standard depths using weighted parabolic interpolation algorithm (Reiniger and Ross, 1968). GEBCO 1min topography is used for the contouring preparation. Analysed filed masked using relative error threshold 0.3 and 0.5. DIVA settings: A constant value for signal-to-noise ratio was used equal to 1. Correlation length was optimized and filtered vertically and a seasonally-averaged profile was used. 'log(data)-exp(analysis' transformation applied to the data prior to the analysis. Background field: the data mean value is subtracted from the data. Detrending of data: no. Advection constraint applied: no. Units: mg/m^3. The entire set of related maps can be found in the viewing service: http://ec.oceanbrowser.net/emodnet/ . Originators of Italian data sets-List of contributors: - Brunetti Fabio (OGS) - Cardin Vanessa, Bensi Manuel doi:10.6092/36728450-4296-4e6a-967d-d5b6da55f306 - Cardin Vanessa, Bensi Manuel, Ursella Laura, Siena Giuseppe doi:10.6092/f8e6d18e-f877-4aa5-a983-a03b06ccb987 - Cataletto Bruno (OGS) - Cinzia Comici Cinzia (OGS) - Civitarese Giuseppe (OGS) - DeVittor Cinzia (OGS) - Giani Michele (OGS) - Kovacevic Vedrana (OGS) - Mosetti Renzo (OGS) - Solidoro C.,Beran A.,Cataletto B.,Celussi M.,Cibic T.,Comici C.,Del Negro P.,De Vittor C.,Minocci M.,Monti M.,Fabbro C.,Falconi C.,Franzo A.,Libralato S.,Lipizer M.,Negussanti J.S.,Russel H.,Valli G., doi:10.6092/e5518899-b914-43b0-8139-023718aa63f5 - Celio Massimo (ARPA FVG) - Malaguti Antonella (ENEA) - Fonda Umani Serena (UNITS) - Bignami Francesco (ISAC/CNR) - Boldrini Alfredo (ISMAR/CNR) - Marini Mauro (ISMAR/CNR) - Miserocchi Stefano (ISMAR/CNR) - Zaccone Renata (IAMC/CNR) - Lavezza, R., Dubroca, L. F. C., Ludicone, D., Kress, N., Herut, B., Civitarese, G., Cruzado, A., Lefèvre, D., Souvermezoglou, E., Yilmaz, A., Tugrul, S., and Ribera d'Alcala, M.: Compilation of quality controlled nutrient profiles from the Mediterranean Sea, doi:10.1594/PANGAEA.771907, 2011.
-
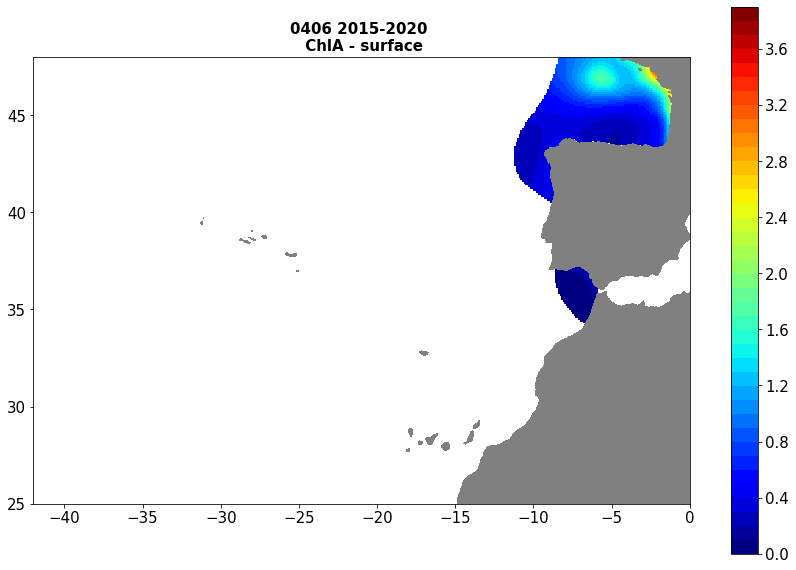
Moving 6-year analysis of Chlorophyll-a at Atlantic Sea for each season. - winter: January-March, - spring: April-June, - summer: July-September, - autumn: October-December Every year of the time dimension corresponds to the 6-year centred average of each season. 6-year periods span from 1972-1977 until 2012-2020. Observational data span from 1972 to 2020. Depth range (IODE standard depths): -300.0, -250.0, -200.0, -150.0, -125.0, -100.0, -75.0, -50.0,-40.0, -30.0, -20.0, -10.0, -5.0, -0.0 Data Sources: observational data from SeaDataNet/EMODNet Chemistry Data Network. Description of DIVA analysis: Geostatistical data analysis by DIVA (Data-Interpolating Variational Analysis) tool. GEBCO 1min topography is used for the contouring preparation. Analyzed filed masked using relative error threshold 0.3 and 0.5 DIVA settings. Correlation length was optimized and filtered vertically and a seasonally-averaged profile was used. Signal to noise ratio was fixed to 1. Logarithmic transformation applied to the data prior to the analysis. Background field: the data mean value is subtracted from the data. Detrending of data: no, Advection constraint applied: no. Units: mg/m^3
-

Moving 10-years analysis of Chlorophyll-a -1.0-ANA at Northeast Atlantic Ocean for each season: - winter: January-March, - spring: April-June, - summer: July-September, - autumn: October-December. Every year of the time dimension corresponds to the 10-year centred average of each season. Decades span from 1985-1994 until 2005-2014. Observational data span from 1970 to 2015. Depth range (IODE standard depths): -300.0, -250.0, -200.0, -150.0, -125.0, -100.0, -75.0, -50.0,-40.0, -30.0, -20.0, -10.0, -5.0, -0.0 Data Sources: observational data from SeaDataNet/EMODNet Chemistry Data Network. Description of DIVA analysis: Geostatistical data analysis by DIVA (Data-Interpolating Variational Analysis) tool. GEBCO 1min topography is used for the contouring preparation. Analyzed filed masked using relative error threshold 0.3 and 0.5 DIVA settings. Signal to noise ratio and correlation length were optimized and filtered vertically and a seasonally-averaged profile was used. Logarithmic transformation applied to the data prior to the analysis. Background field: the data mean value is subtracted from the data. Detrending of data: no, Advection constraint applied: no. Units: mg/m^3
-
Moving 6-year analysis of Water body chlorophyll-a in the Baltic Sea. Four seasons (March-May, June-August, September-November, December-February). Every year of the time dimension corresponds to a 6-year centred average. Periods span between 1980-1985 and 2013-2018. Analyses for depths (m) (HELCOM standard depths): 0, 5, 10, 15, 20, 30, 40, 50, 60, 70, 80, 90, 100, 125, 150, 175, 200, 225, 250, 275, 300. Data Sources: observational data from SeaDataNet/EMODnet Chemistry Data Network. Description of DIVA analysis: Geostatistical data analysis by DIVA (Data-Interpolating Variational Analysis) tool. GEBCO Grid (30 arc-seconds) topography is used for the contouring preparation. Files contain analysed fields, error fields and combined field with the deepest value for each grid point selected. Also pre-masked fields using relative error threshold 0.3 and 0.5 are included. In the analyses the Correlation length in the horizontal direction were fixed to 80 km and in the vertical direction to 25 m. Signal to noise ratio were fixed to 1.0. Background fields were created using data for the given time period and season. Log transformation was used in the analyses. No detrending, advection constraints or weighting are applied. Unit is mg/m3.