 Metadata catalogue
software
Type of resources
Topics
INSPIRE themes
Keywords
Contact for the resource
Provided by
Years
Representation types
Scale
-
Sediment Profile Images (SPIs) are commonly used to map physical, biological and chemical/nutrient gradients in benthic habitats. SpiArcBase is a software that has been developed for the analysis of Sediment Profile Images (SPIs). It has been conceived to improve the objectivity of extracted information (especially the apparent Redox Potential Discontinuity (aRPD). The software presents a graphical user interface designed to enhance the interpretation of features observed on SPIs in an objective manner and to facilitate image management and structures visualization via a data base.The software also allows for the storage of generated data and the automatic computation of a benthic habitat quality index. The facilities provided within JERICONext include access to the software through free downloading and assistance in its utilization.
-
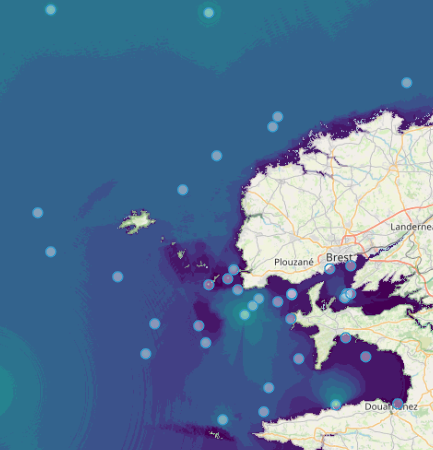
Quonops Online Services provide noise monitoring and prediction tools. In a similar manner to weather forecasting systems, Quonops© produces an estimate of the spatio-temporal distribution of noise levels generated by human activities at sea, aggregating multiple sources, and assessing short-, mid- and long-term source contributions to the global noise field. The outputs from Quonops© are tailored to the requirements of existing and emerging national and international regulations regarding: - Underwater noise. - The conservation of habitats and marine ecosystems. - The protection of marine species. Such tools aim to support management decisions by assessing, quantifying and prioritizing direct and indirect anthropogenic pressures on marine life, according to regulations on underwater noise, especially the descriptor 11 of the European Marine Strategy Framework Directive.
-
The Non-Native Species (NNS) tool, to be developed using R-shiny, will allow users to map the distribution of non-native species across the UK seas, using data from 777 benthic surveys (33,198 samples). These data come from the ‘big data’ study of Cooper and Barry (2017). The tool will be made available on the existing www.benthosapps.net website. This site will offer a number of benthic related tools, allowing users (industry, government, public) to interact with existing benthic datasets and associated data products. On the website, tools can be bundled together into industry specific applications. See, for example, the Marine Aggregates Application (MAPP), https://www.benthosapps.net/ma_tool/. In due course, it is planned to produce similar applications for other industry sectors.
-
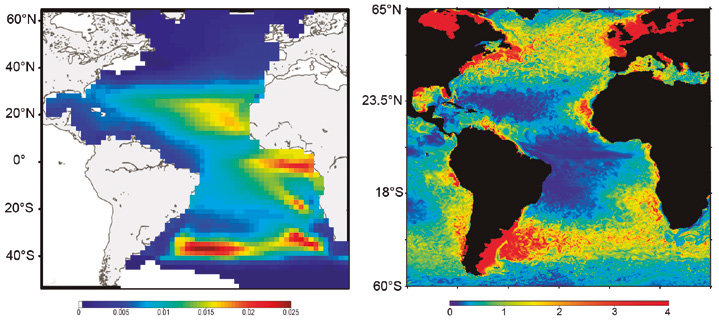
SEAPODYM has been initiated in the mid-1990s by the Oceanic Fisheries Programme of the Secretariat of the Pacific Community (SPC) and developed under several European development projects. The objective was to propose new management tools taking into account both the fishing impact and environmental variability. Since 2006, in partnership with SPC, its development has continued with the Marine Ecosystem Modeling team of CLS (Collecte Localisation Satellite). CLS aims to combine this modeling approach with satellite observation and real-time data collection to develop operational real-time applications and advise government administrations on the sustainable management and monitoring of marine resources. The main features of SEAPODYM framework are: - Prediction of the temporal and spatial distributions of functional lower and mid-trophic level groups (Lehodey et al. 2010; 2015) - Prediction of the temporal and spatial distributions of age-structured predator (fish) populations (Lehodey et al. 2008); - Prediction of the total catch and the size-frequency of catch by fishing fleet; - Parameter optimization based on data assimilation techniques (Senina et al., 2008); The lower and mid-trophic level (LMTL) sub-model describes the dynamics of a functional group of zooplankton and several vertically migrant and non-migrant micronekton (prey of larger fish) groups. The dynamics are linked to temperature and currents. Assimilation of acoustic or biomass data is used to estimate the model parameters. The dynamics of fish populations are estimated using habitat indices, movements, growth and mortality. The feeding habitat is based on the accessibility of fish to the groups of prey. The spawning habitat combines temperature preference and coincidence of spawning with presence or absence of predators and food for larvae. Successful larval recruitment is linked to spawning stock biomass and mortality during the drift with currents. Older fish can swim along the gradient of habitat index in addition to being advected by ocean currents.
-
Visualization tools for real time water quality data have been developed (swell.fmi.fi/Algaline/about.html). The first demonstration product includes ferrybox data from passanger ferry Silja Serenade commuting between Helsinki, Finland and Stockholm, Sweden. Tools include python and R scripts for data transfer and visualization. Plots include transect plots and contour plots for last 1 month period and for the current year. Variables include Temperature, Salinity, CDOM, Chlorophyll a, Oxygen, Phycocyanin and Turbidity. Transect data shows also which parts of the data are flagged as bad quality data. A map showing transects and the current location of ship is also included.