 Metadata catalogue
Arctic Ocean
Type of resources
Available actions
Topics
INSPIRE themes
Keywords
Contact for the resource
Provided by
Years
Formats
Representation types
Update frequencies
Scale
Resolution
-
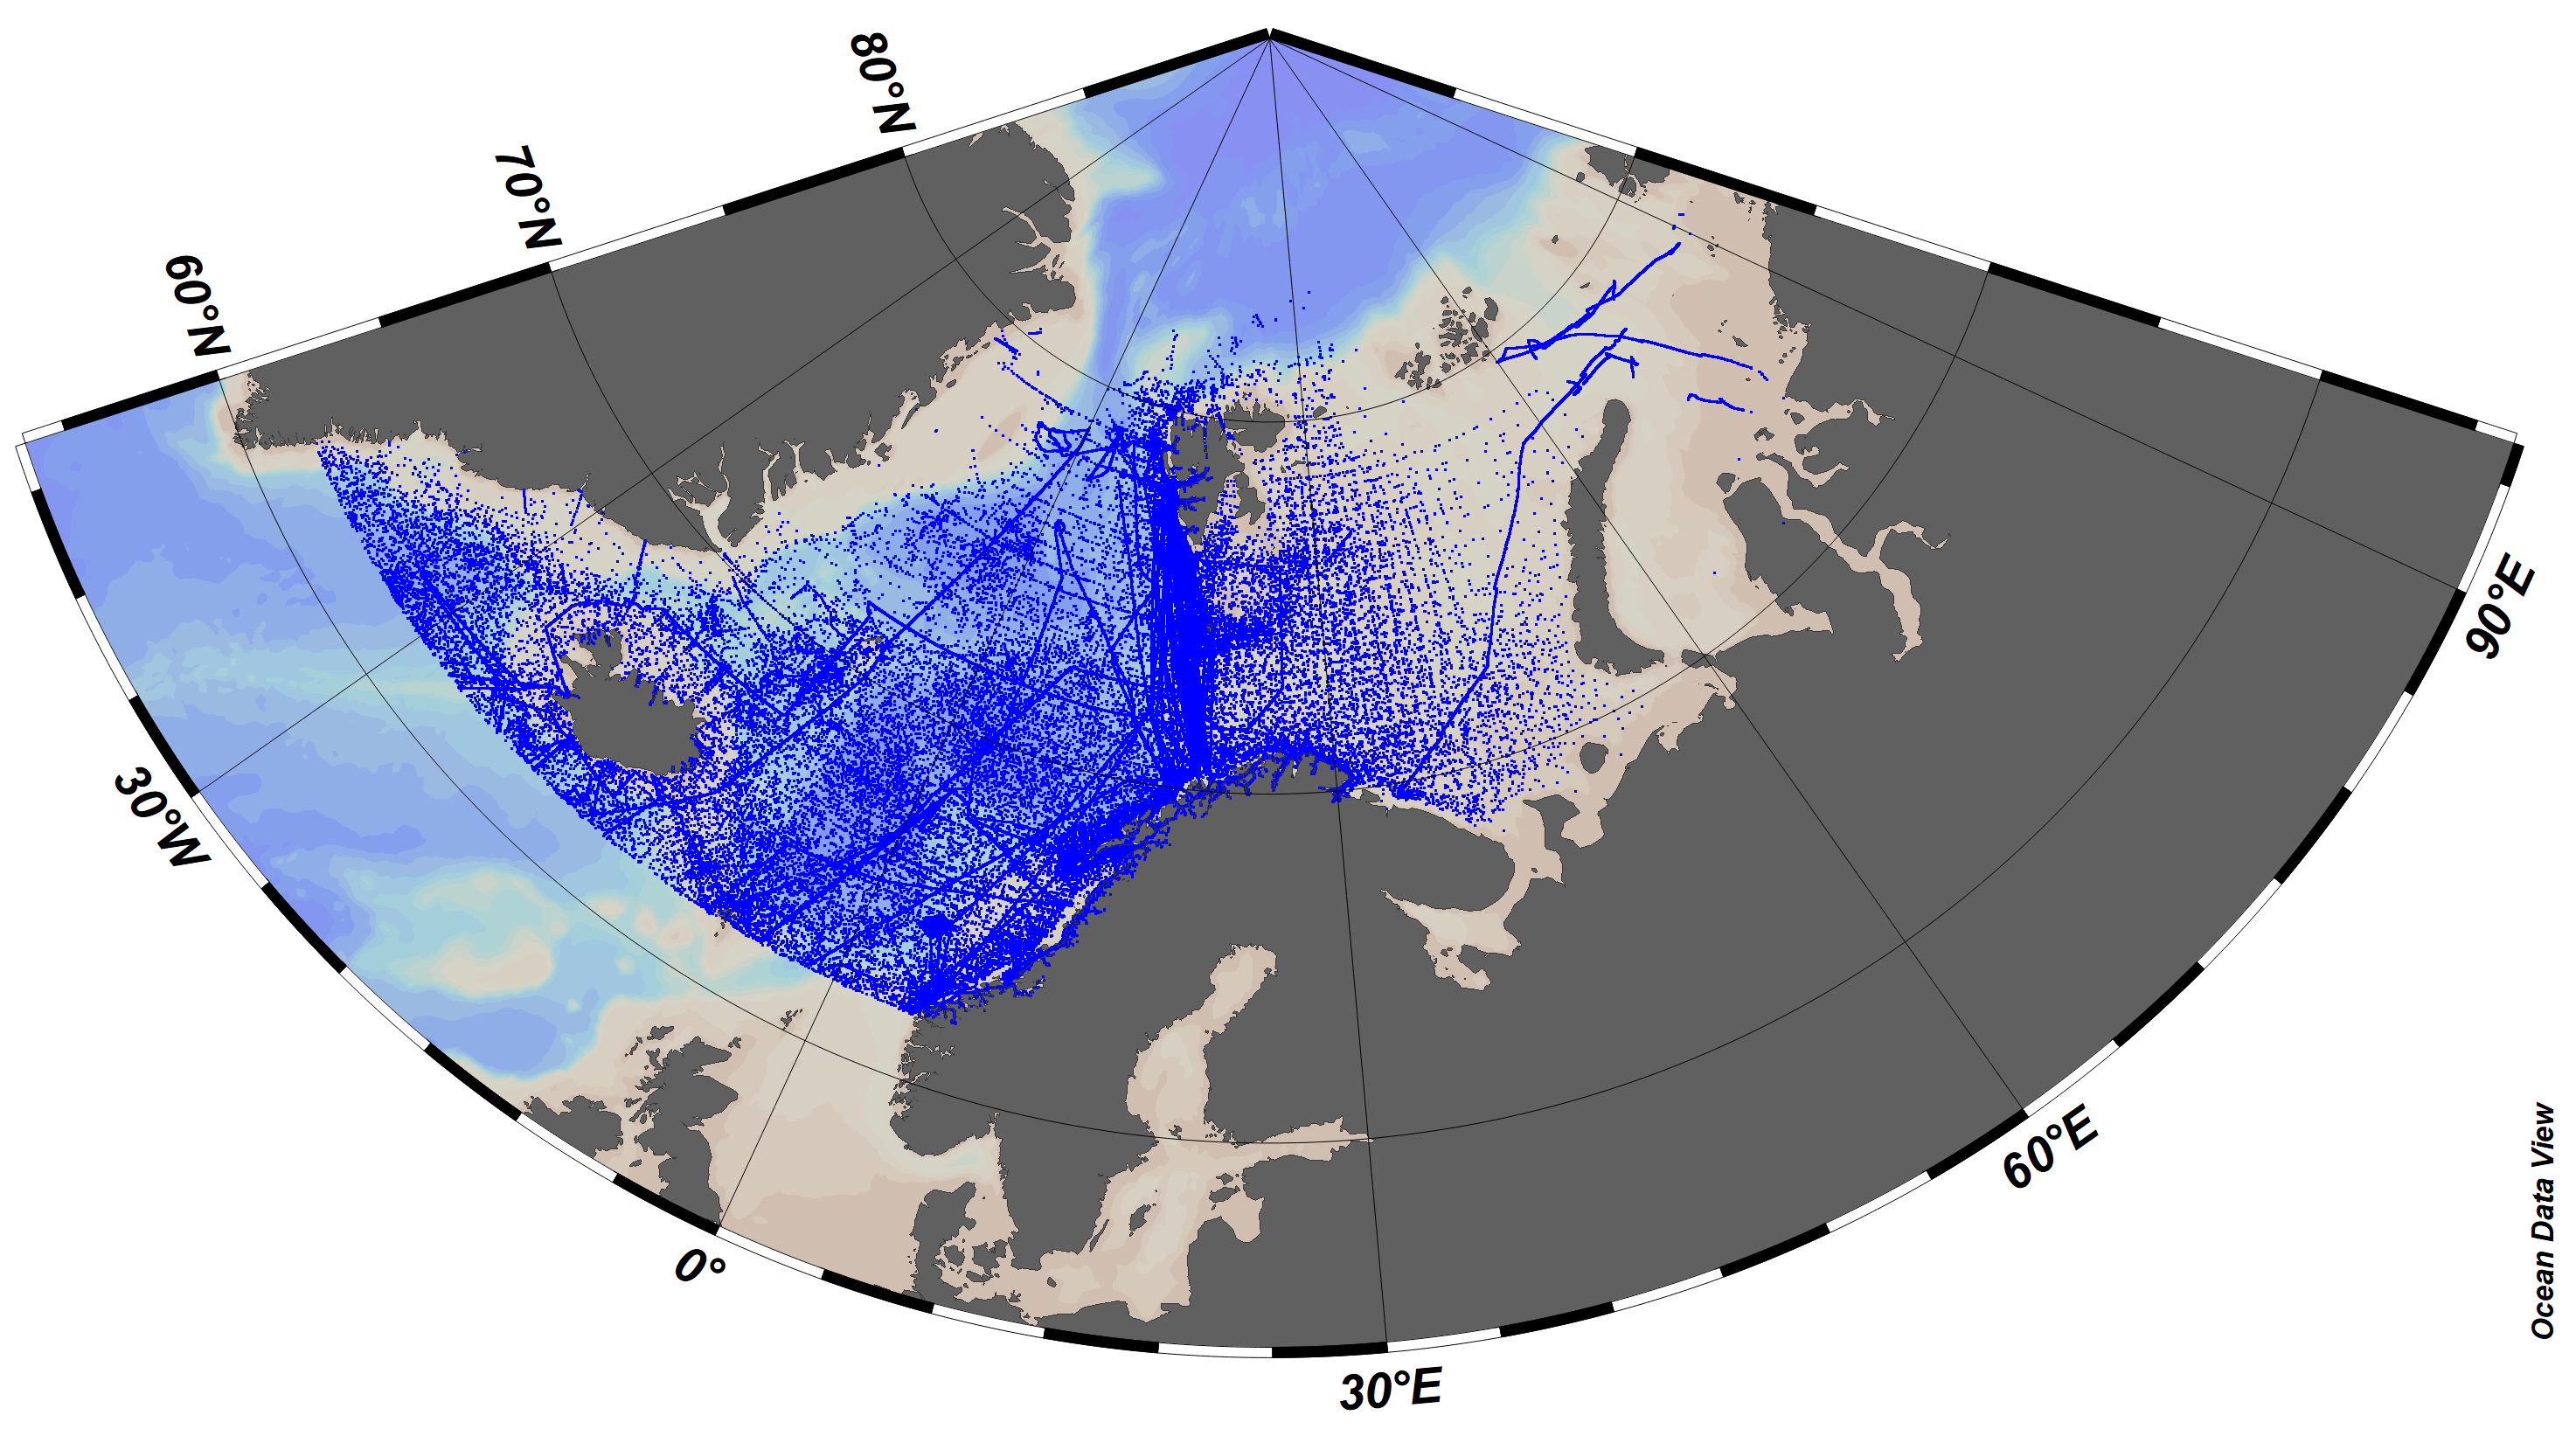
SeaDataCloud Temperature and Salinity historical data collection for the Arctic Ocean, including revised quality flags after quality control with ODV. The dataset format is ODV binary collections. You can read, analyse and export from the ODV application provided by Alfred Wegener institute at http://odv.awi.de/. For data access please register at http://www.marine-id.org/.
-

SeaDataNet Temperature and Salinity historical data collection for the North Arctic Ocean, including revised quality flags after quality control with ODV. For data access please register at http://www.marine-id.org The dataset format is ODV binary collections. You can read, analyse and export from the ODV application provided by Alfred Wegener institute at http://odv.awi.de/
-
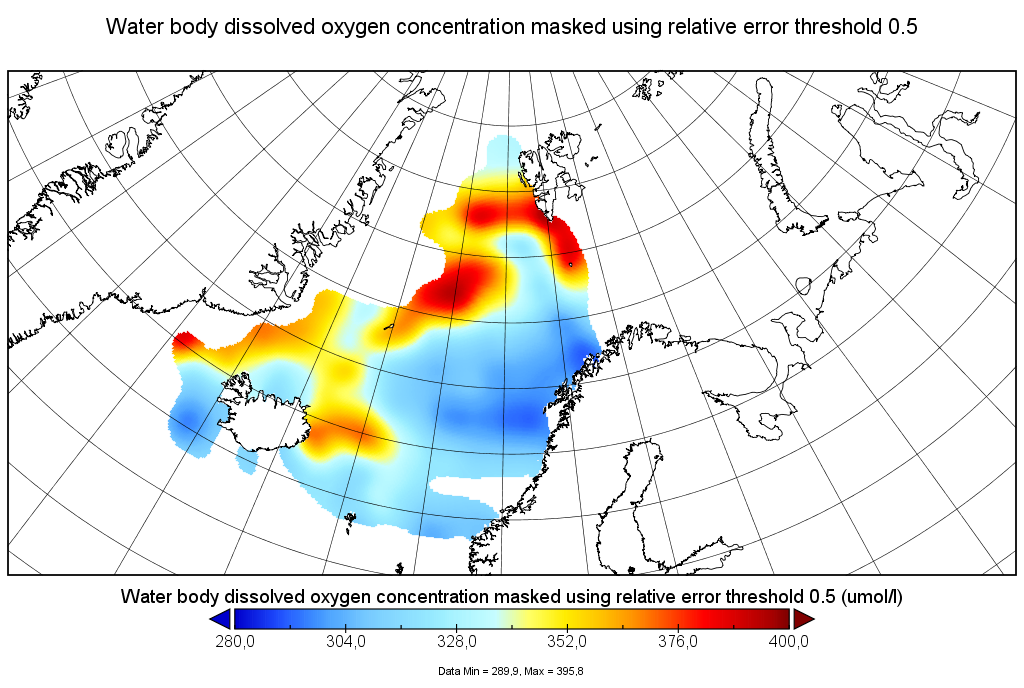
Moving 6-year analysis of Water body dissolved oxygen concentration in the Arctic Ocean, for each season in the period 1965-2017. Every year of the time dimension corresponds to the 6-year centered average for each season. Winter: December-February, Spring: March-May, Summer: June-August, Autumn: September-November. Depth range (IODE standard depths): 0, 5, 10, 20, 30, 40, 50, 75, 100, 125, 150, 200, 250, 300, 400, ..., 1500, 1750, 2000, 2500m. Units: umol/l. Description of DIVA analysis: The computation was done with the DIVAnd (Data-Interpolating Variational Analysis in n dimensions), version 2.6.6, using GEBCO 30sec topography for the spatial connectivity of water masses. The horizontal resolution of the produced DIVAnd maps grids is 0.1 degrees. Signal-to-noise ratio was fixed to 2.0, horizontal correlation length to 100 km, and vertical correlation length varying between 25 and 200 m. Logarithmic transformation is applied to the data prior to the analysis. Background field: the data mean value is subtracted from the data.
-
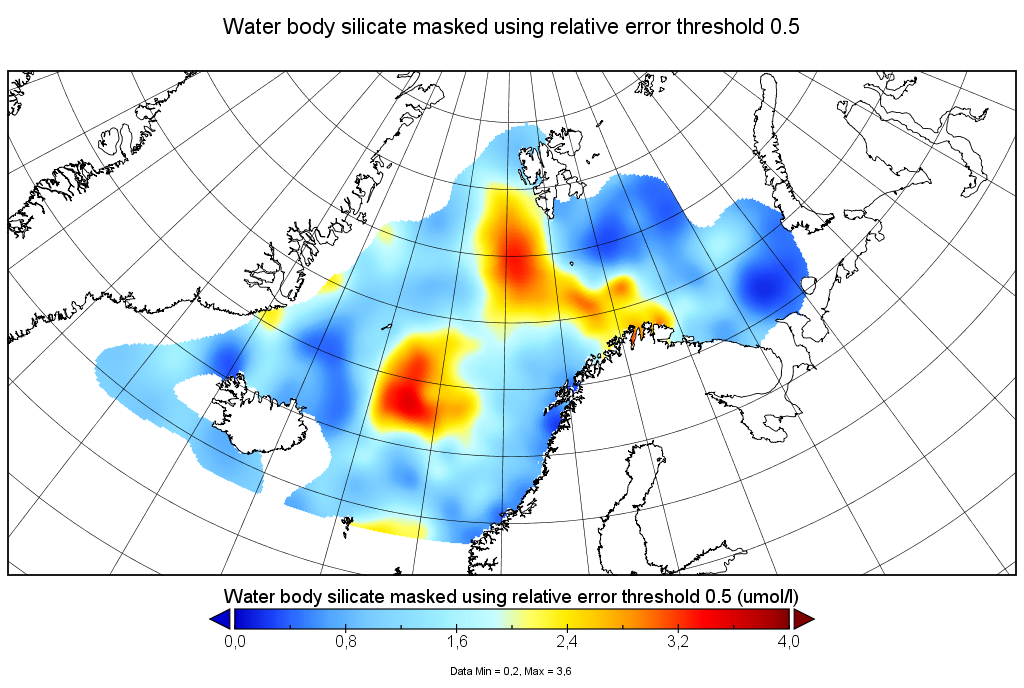
Moving 6-year analysis of Water body silicate in the Arctic Ocean, for each season in the period 1965-2017. Every year of the time dimension corresponds to the 6-year centered average for each season. Winter: December-February, Spring: March-May, Summer: June-August, Autumn: September-November. Depth range (IODE standard depths): 0, 5, 10, 20, 30, 40, 50, 75, 100, 125, 150, 200, 250, 300, 400, ..., 1500, 1750, 2000, 2500m. Units: umol/l. Description of DIVA analysis: The computation was done with the DIVAnd (Data-Interpolating Variational Analysis in n dimensions), version 2.6.6, using GEBCO 30sec topography for the spatial connectivity of water masses. The horizontal resolution of the produced DIVAnd maps grids is 0.1 degrees. Signal-to-noise ratio was fixed to 2.0, horizontal correlation length to 100 km, and vertical correlation length varying between 25 and 200 m. Logarithmic transformation is applied to the data prior to the analysis. Background field: the data mean value is subtracted from the data.
-
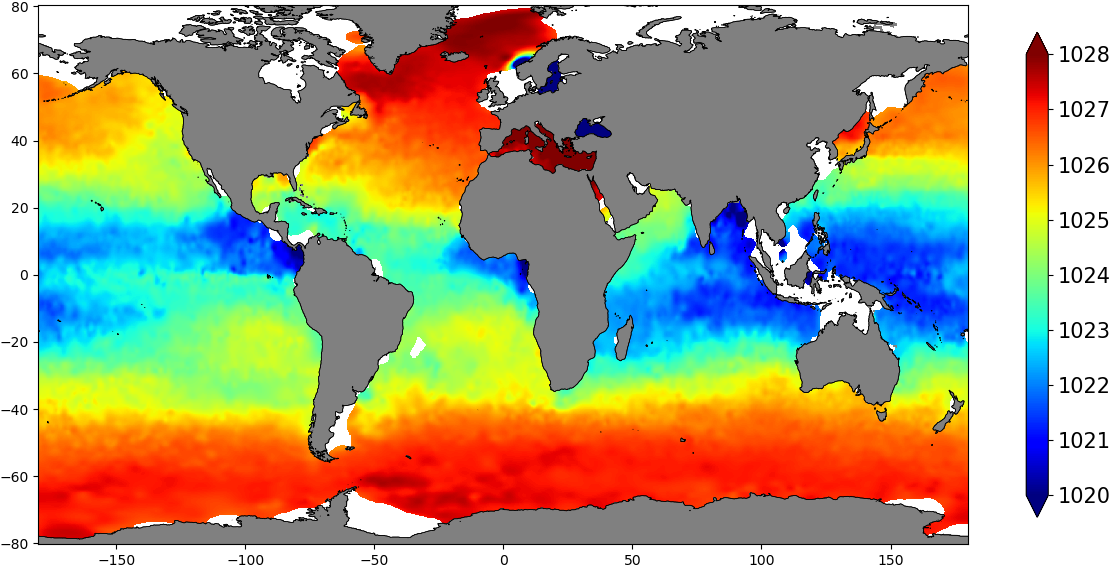
The SDC_GLO_CLIM_Dens product contains global monthly climatological estimates of in situ density using Temperature and Salinity from profiling floats contained in the World Ocean Data 18 (WOD18) database. The profiles were first quality controlled with a Nonlinear Quality control procedure. The climatology considers observations from surface to 2000 m for the time period 2003-2017. Density profiles are computed using UNESCO 1983 (EOS 80) equation from in situ temperature, salinity and pressure measurements by the PFL. Only profiles with both T,S values were used. The gridded fields are computed using DIVAnd (Data Interpolating Variational Analysis) version 2.3.1.
-

Moving 6-year analysis of chlorophyll-a in the Arctic Region for each season: winter (December-February), spring (March-May), summer (June-August) and autumn (September-November). Every year of the time dimension corresponds to the 6-year centred average of each season. 6-year periods span from 1980-1985, 1981-1986, ....., until 2012-2017. Depth range (IODE standard depths): -300.0, -250.0, -200.0, -150.0, -125.0, -100.0, -75.0, -50.0,-40.0, -30.0, -20.0, -10.0, -5.0, -0.0. Data Sources: observational data from SeaDataNet/EMODnet Chemistry Data Network. Description of DIVA analysis: Geostatistical data analysis by DIVA (Data-Interpolating Variational Analysis) tool. GEBCO 1min topography is used for the contouring preparation. Analysed field masked using relative error threshold 0.3 and 0.5. DIVA settings: signal-to-noise ratio and correlation length were estimated using data mean distance as a minimum (for L) and vertically filtered. Background field: A reference field of all seasonal data between 1980-2017. Detrending of data: no. Advection constraint applied: no. Units: umol/l. The entire set of related maps can be found in the viewing service: http://ec.oceanbrowser.net/emodnet/ .
-
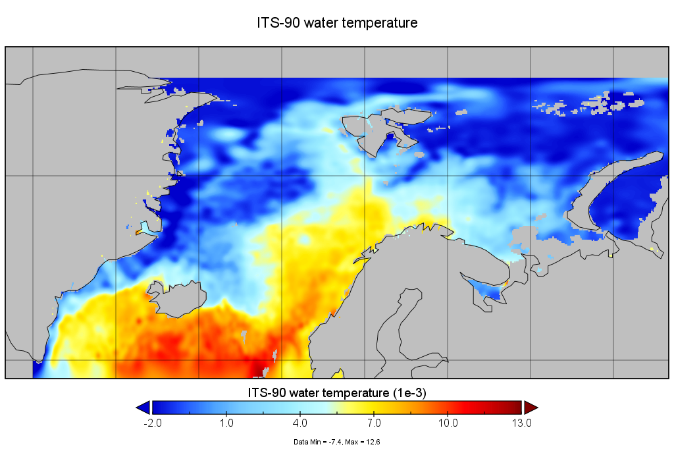
The SeaDataCloud Temperature and Salinity Climatologies have been processed from the historical Data Collection of the Arctic Ocean (from 56°N to 83°N and from 45°W to 70°E) including temperature and salinity in situ data of the water column for the period 1955 – 2019. The analysis was run in six decadal periods (1955-1964/1965-1974/1975-1984/1985-1994/1995-2004/2005-2014). A subset of the World Ocean Database 2018 (WOD18, https://www.nodc.noaa.gov/OC5/WOD/pr_wod.html) dataset has been integrated as external data-source to improve data availability for analysis.
-
Water body dissolved oxygen concentration - Monthly Climatology for the European Seas for the period 1960-2020 on the domain from longitude -45.0 to 70.0 degrees East and latitude 24.0 to 83.0 degrees North. Data Sources: observational data from SeaDataNet/EMODnet Chemistry Data Network. Description of DIVA analysis: The computation was done with the DIVAnd (Data-Interpolating Variational Analysis in n dimensions), version 2.7.2, using GEBCO 30sec topography for the spatial connectivity of water masses. Horizontal correlation length and vertical correlation length vary spatially depending on the topography and domain. Depth range: 0.0, 5.0, 10.0, 15.0, 20.0, 25.0, 30.0, 35.0, 40.0, 45.0, 50.0, 55.0, 60.0, 65.0, 70.0, 75.0, 80.0, 85.0, 90.0, 95.0, 100.0, 125.0, 150.0, 175.0, 200.0, 225.0, 250.0, 275.0, 300.0, 325.0, 350.0, 375.0, 400.0, 425.0, 450.0, 475.0, 500.0, 550.0, 600.0, 650.0, 700.0, 750.0, 800.0, 850.0, 900.0, 950.0, 1000.0, 1050.0, 1100.0, 1150.0, 1200.0, 1250.0, 1300.0, 1350.0, 1400.0, 1450.0, 1500.0, 1550.0, 1600.0, 1650.0, 1700.0, 1750.0, 1800.0, 1850.0, 1900.0, 1950.0, 2000.0, 2100.0, 2200.0, 2300.0, 2400.0, 2500.0, 2600.0, 2700.0, 2800.0, 2900.0, 3000.0, 3100.0, 3200.0, 3300.0, 3400.0, 3500.0, 3600.0, 3700.0, 3800.0, 3900.0, 4000.0, 4100.0, 4200.0, 4300.0, 4400.0, 4500.0, 4600.0, 4700.0, 4800.0, 4900.0, 5000.0, 5100.0, 5200.0, 5300.0, 5400.0, 5500.0 m. Units: umol/l. The horizontal resolution of the produced DIVAnd analysis is 0.25 degrees.
-
EMODnet Chemistry aims to provide access to marine chemistry data sets and derived data products concerning eutrophication, ocean acidification and contaminants. The chemicals chosen reflect importance to the Marine Strategy Framework Directive (MSFD). This regional aggregated dataset contains all unrestricted EMODnet Chemistry data on contaminants; temperature, salinity and additional sampling parameters are included when available. The spatial coverage is the Arctic Ocean with 780 CDI records divided per matrices: 249 water profiles and 531 sediment profiles. For water, vertical profiles temporal range is from 1974-03-25 to 2011-08-24. For sediment, vertical profiles temporal range is from 1974-08-07 to 2017-10-26. Data were aggregated and quality controlled by ‘Institute of Marine Research - Norwegian Marine Data Centre (NMD)’ from Norway. Regional datasets concerning contaminants are automatically harvested. Parameter names in these datasets are based on P01, BODC Parameter Usage Vocabulary, which is available at: http://seadatanet.maris2.nl/bandit/browse_step.php . Each measurement value has a quality flag indicator. The resulting data collections for each Sea Basin are harmonised, and the collections are quality controlled by EMODnet Chemistry Regional Leaders using ODV Software and following a common methodology for all Sea Regions. Harmonisation means that: (1) unit conversion is carried out to express contaminant concentrations with a limited set of measurement units (according to EU directives 2013/39/UE; Comm. Dec. EU 2017/848) and (2) merging of variables described by different “local names” ,but corresponding exactly to the same concepts in BODC P01 vocabulary. Detailed documentation is available at: https://doi.org/10.6092/8b52e8d7-dc92-4305-9337-7634a5cae3f4 Explore and extract data at: https://emodnet-chemistry.webodv.awi.de/contaminants%3EArctic The harmonised dataset can also be downloaded as ODV spreadsheet (TXT file), which is composed of metadata header followed by tab separated values. This worksheet can be imported to ODV Software for visualisation (More information can be found at: https://www.seadatanet.org/Software/ODV ). The same dataset is offered also as TXT file in a long/vertical format, in which each P01 measurement is a record line. Additionally, there are a series of columns that split P01 terms in subcomponents (measure, substance, CAS number, matrix...).This transposed format is more adapted to worksheet applications users (e.g. LibreOffice Calc). The original datasets can be searched and downloaded from EMODnet Chemistry Download Service: https://emodnet-chemistry.maris.nl/search
-
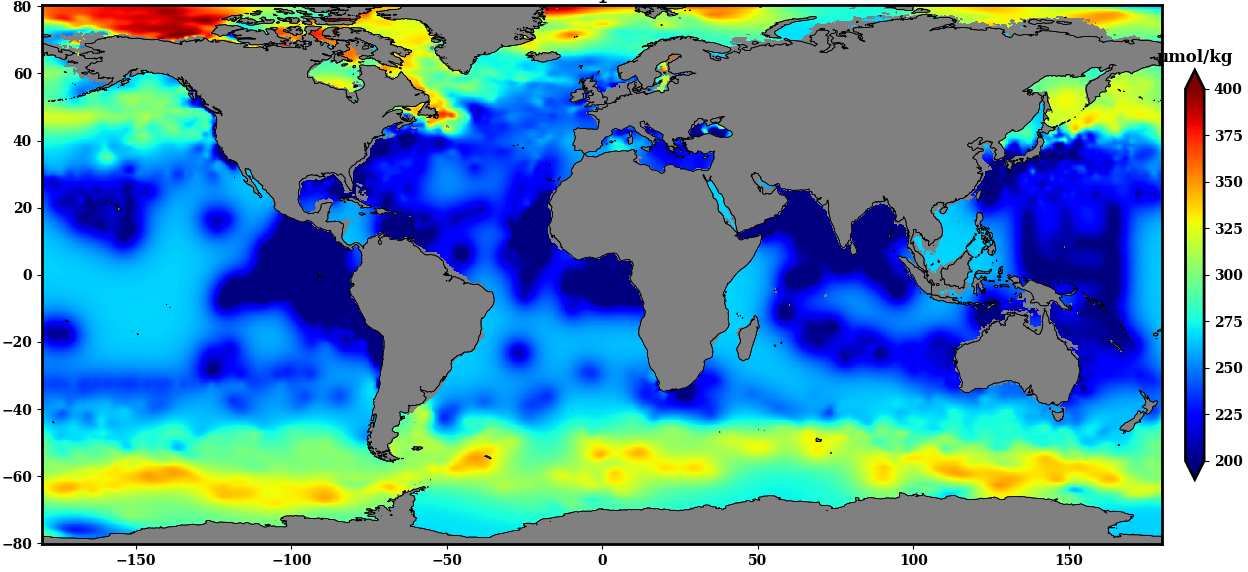
The SDC_GLO_CLIM_O2_AOU product contains two different monthly climatology for dissolved Oxygen and Apparent Oxygen Utilization, SDC_GLO_CLIM_O2 and SDC_GLO_CLIM_AOU respectively from the World Ocean Data (WOD) database. Only basic quality control flags from the WOD are used. The first climatology, SDC_GLO_CLIM_O2, considers Dissolved Oxygen profiles casted together with temperature and salinity from CTD, Profiling Floats (PFL) and Ocean Station Data (OSD) for time duration 2003 to 2017. The second climatology, SDC_GLO_CLIM_AOU, apparent Oxygen utilization, is computed as a difference of dissolved oxygen and saturation O2 profiles. The gridded fields are computed using DIVAnd (Data Interpolating Variational Analysis) version 2.3.1.