 Metadata catalogue
0.1 degree
Type of resources
Available actions
Topics
INSPIRE themes
Keywords
Contact for the resource
Provided by
Years
Formats
Representation types
Resolution
-
Moving 6-year analysis and visualization of Water body dissolved inorganic nitrogen (DIN ) in the North Sea, four seasons: winter (dec-feb), spring (mar-may), summer (jun-aug), autumn (sep-nov). Data Sources: observational data from SeaDataNet/EMODnet Chemistry Data Network. Description of DIVA analysis: Geostatistical data analysis by DIVAnd (Data-Interpolating Variational Analysis) tool, version 2.7.2. results were subjected to the minfield option in DIVAnd to avoid negative/underestimated values in the interpolated results; error threshold masks L1 (0.3) and L2 (0.5) are included as well as the unmasked field. The depth dimension allows visualizing the gridded field at various depths.
-
Moving 6-year analysis of Water body chlorophyll-a in the Baltic Sea. Four seasons (March-May, June-August, September-November, December-February). Every year of the time dimension corresponds to a 6-year centred average. Periods span between 1980-1985 and 2013-2018. Analyses for depths (m) (HELCOM standard depths): 0, 5, 10, 15, 20, 30, 40, 50, 60, 70, 80, 90, 100, 125, 150, 175, 200, 225, 250, 275, 300. Data Sources: observational data from SeaDataNet/EMODnet Chemistry Data Network. Description of DIVA analysis: Geostatistical data analysis by DIVA (Data-Interpolating Variational Analysis) tool. GEBCO Grid (30 arc-seconds) topography is used for the contouring preparation. Files contain analysed fields, error fields and combined field with the deepest value for each grid point selected. Also pre-masked fields using relative error threshold 0.3 and 0.5 are included. In the analyses the Correlation length in the horizontal direction were fixed to 80 km and in the vertical direction to 25 m. Signal to noise ratio were fixed to 1.0. Background fields were created using data for the given time period and season. Log transformation was used in the analyses. No detrending, advection constraints or weighting are applied. Unit is mg/m3.
-
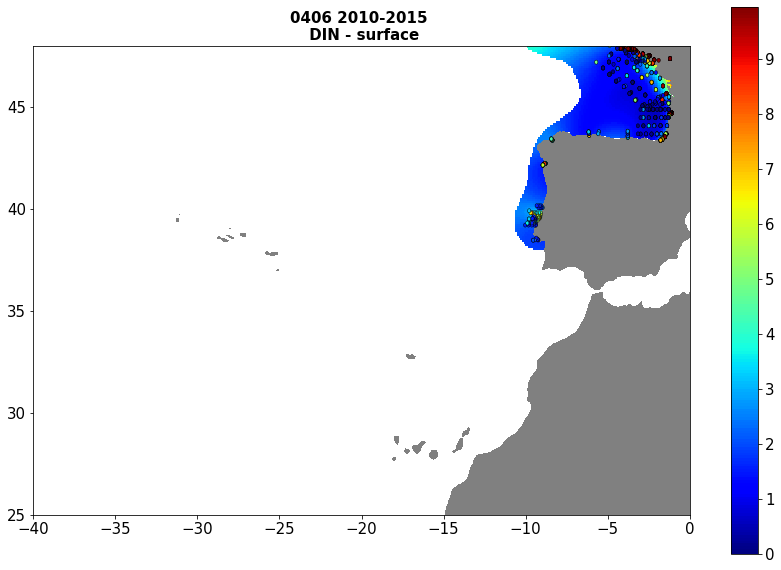
Moving 6-year analysis of Dissolved Inorganic Nitrogen at Atlantic Sea for each season. - winter: January-March, - spring: April-June, - summer: July-September, - autumn: October-December Every year of the time dimension corresponds to the 6-year centred average of each season. 6-year periods span - from 1988-1993 until 2015-2020 (winter), - from 1988-1993 until 2015-2020 (spring), - from 1986-1991 until 2015-2020 (summer), - from 1984-1989 until 2015-2020 (autumn). Observational data span from 1984 to 2020. Depth range (IODE standard depths): -2000.0, -1750, -1500.0, -1400.0, -1300.0, -1200.0, -1100.0, -1000.0, -900.0, -800.0, -700.0, -600.0, -500.0, -400.0, -300.0, -250.0, -200.0, -150.0, -125.0, -100.0, -75.0, -50.0,-40.0, -30.0, -20.0, -10.0, -5.0, -0.0 Data Sources: observational data from SeaDataNet/EMODNet Chemistry Data Network. Description of DIVA analysis: Geostatistical data analysis by DIVA (Data-Interpolating Variational Analysis) tool. GEBCO 1min topography is used for the contouring preparation. Analyzed filed masked using relative error threshold 0.3 and 0.5 DIVA settings. Correlation length was optimized and filtered vertically and a seasonally-averaged profile was used. Signal to noise ratio was fixed to 1. Logarithmic transformation applied to the data prior to the analysis. Background field: the data mean value is subtracted from the data. Detrending of data: no, Advection constraint applied: no. Units: umol/l
-
Moving 6-year analysis of Water body dissolved inorganic nitrogen (DIN) in the Baltic Sea. Four seasons (March-May, June-August, September-November, December-February). Every year of the time dimension corresponds to a 6-year centred average. Periods span between 1980-1985 and 2013-2018. Analyses for depths (m) (HELCOM standard depths): 0, 5, 10, 15, 20, 30, 40, 50, 60, 70, 80, 90, 100, 125, 150, 175, 200, 225, 250, 275, 300. Data Sources: observational data from SeaDataNet/EMODnet Chemistry Data Network. Description of DIVA analysis: Geostatistical data analysis by DIVA (Data-Interpolating Variational Analysis) tool. GEBCO Grid (30 arc-seconds) topography is used for the contouring preparation. Files contain analysed fields, error fields and combined field with the deepest value for each grid point selected. Also pre-masked fields using relative error threshold 0.3 and 0.5 are included. In the analyses the Correlation length in the horizontal direction were fixed to 80 km and in the vertical direction to 25 m. Signal to noise ratio were fixed to 1.0. Background fields were created using data for the given time period and season. Log transformation was used in the analyses. No detrending, advection constraints or weighting are applied. Unit is umol/l.
-
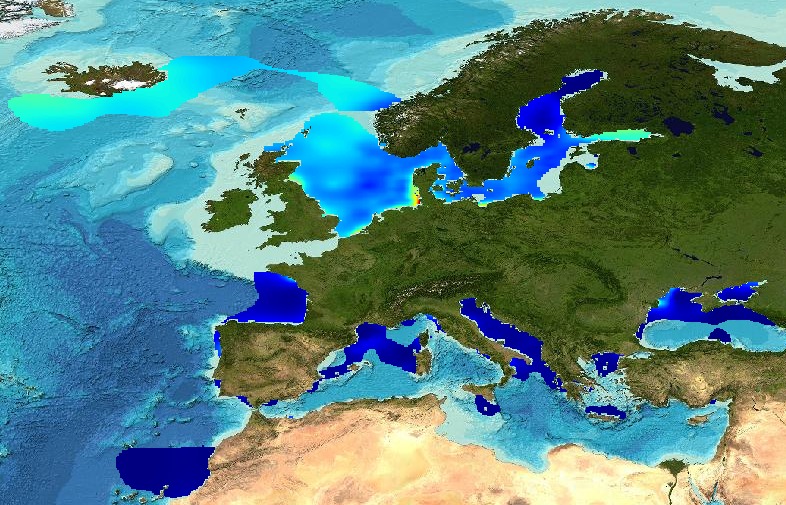
The analysis was performed per season using DIVA software tool (Data-Interpolating Variational Analysis). The analyses products are stored as NetCDF CF files and made available as WMS layers for easy browsing and adding. Every step of the time dimension corresponds to a 6-year moving average from 1983 to 2016. The depth dimension spans from surface to 1000 m, with 21 vertical levels. The boundaries and overlapping zones between these regions were filtered to avoid any unrealistic spatial discontinuities. This combined water body dissolved oxygen concentration product is masked using the relative error threshold 0.5. Units: µmol/l Created by 'University of Liège, GeoHydrodynamics and Environment Research (ULiège-GHER)'. The data used as input for DIVA have been extracted from the EMODnet Chemistry Download Service: https://emodnet-chemistry.maris.nl/search Intermediate regional data products: Mediterranean Sea - DIVA 4D 6-year analysis of Water body phosphate 1968/2016 v2018 https://doi.org/10.6092/165371b0-d5d3-4188-bf20-74b139cf5e4b Arctic Ocean - DIVA 4D 6-year analysis of Water body phosphate 1980/2017 v2018 https://doi.org/10.6092/d0618e05-bc9b-4212-9aa3-12eb2a6b8756 North Sea - DIVA 4D 6-year analysis of Water body phosphate 1980/2017 v2018 https://doi.org/10.6092/61170426-61e4-40c0-b45b-7e23fa1dbe84 Black Sea - DIVA 4D 6-year analysis of Water body phosphate 1990/2016 v2018 https://doi.org/10.6092/dfe8bcc1-4d97-4962-9857-d3f8e0ce1fc6 North East Atlantic Ocean - DIVA 4D 6-year analysis of Water body phosphate 1960/2017 v2018 https://doi.org/10.6092/54a52f81-d8bf-457f-aee3-d48a25645727 Baltic Sea - DIVA 4D 6-year analysis of Water body phosphate 1980/2016 v2018 https://doi.org/10.6092/e5bfc6fd-f287-4e1d-81ae-6af0ea3f1eef
-

Combined product of Water body phosphate based on DIVA 4D 10-year analysis on five regions : Northeast Atlantic Ocean, North Sea, Baltic Sea, Black Sea, Mediterranean Sea. The boundaries and overlapping zones between these five regions were filtered to avoid any unrealistic spatial discontinuities. This combined water body phosphate product is masked using the relative error threshold 0.5. Units: umol/l
-

Moving 10-years analysis of Chlorophyll-a -1.0-ANA at Northeast Atlantic Ocean for each season: - winter: January-March, - spring: April-June, - summer: July-September, - autumn: October-December. Every year of the time dimension corresponds to the 10-year centred average of each season. Decades span from 1985-1994 until 2005-2014. Observational data span from 1970 to 2015. Depth range (IODE standard depths): -300.0, -250.0, -200.0, -150.0, -125.0, -100.0, -75.0, -50.0,-40.0, -30.0, -20.0, -10.0, -5.0, -0.0 Data Sources: observational data from SeaDataNet/EMODNet Chemistry Data Network. Description of DIVA analysis: Geostatistical data analysis by DIVA (Data-Interpolating Variational Analysis) tool. GEBCO 1min topography is used for the contouring preparation. Analyzed filed masked using relative error threshold 0.3 and 0.5 DIVA settings. Signal to noise ratio and correlation length were optimized and filtered vertically and a seasonally-averaged profile was used. Logarithmic transformation applied to the data prior to the analysis. Background field: the data mean value is subtracted from the data. Detrending of data: no, Advection constraint applied: no. Units: mg/m^3
-

Moving 10-years analysis of Oxygen at Northeast Atlantic Ocean for each season: - winter: January-March, - spring: April-June, - summer: July-September, - autumn: October-December. Every year of the time dimension corresponds to the 10-year centred average of each season. Decades span from 1963-1972 until 2005-2014. Observational data span from 1963 to 2014. Depth range (IODE standard depths): -3000.0, -2500.0, -2000.0, -1750, -1500.0, -1400.0, -1300.0, -1200.0, -1100.0, -1000.0, -900.0, -800.0, -700.0, -600.0, -500.0, -400.0, -300.0, -250.0, -200.0, -150.0, -125.0, -100.0, -75.0, -50.0,-40.0, -30.0, -20.0, -10.0, -5.0, -0.0 Data Sources: observational data from SeaDataNet/EMODNet Chemistry Data Network. Description of DIVA analysis: Geostatistical data analysis by DIVA (Data-Interpolating Variational Analysis) tool. GEBCO 1min topography is used for the contouring preparation. Analyzed filed masked using relative error threshold 0.3 and 0.5 DIVA settings. Signal to noise ratio and correlation length were optimized and filtered vertically and a seasonally-averaged profile was used. Background field: the data mean value is subtracted from the data. Detrending of data: no, Advection consraint applied: no. Units: umol/l
-
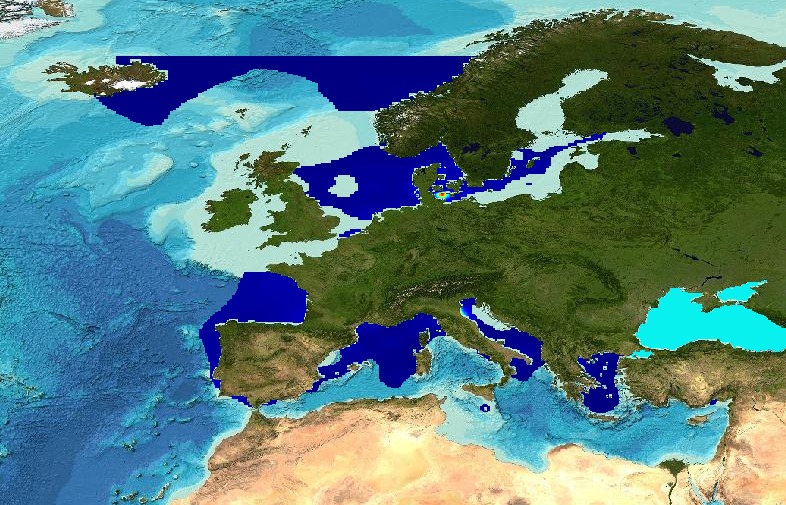
The analysis was performed per season using DIVA software tool (Data-Interpolating Variational Analysis). The analyses products are stored as NetCDF CF files and made available as WMS layers for easy browsing and adding. Every step of the time dimension corresponds to a 6-year moving average from 1983 to 2016. The depth dimension spans from surface to 1000 m, with 21 vertical levels. The boundaries and overlapping zones between these regions were filtered to avoid any unrealistic spatial discontinuities. This combined water body dissolved oxygen concentration product is masked using the relative error threshold 0.5. Units: µmol/l Created by 'University of Liège, GeoHydrodynamics and Environment Research (ULiège-GHER)'. The data used as input for DIVA have been extracted from the EMODnet Chemistry Download Service: https://emodnet-chemistry.maris.nl/search Intermediate regional data products: Mediterranean Sea - DIVA 4D 6-year analysis of Water body chlorophyll-a 1990/2017 v2018 https://doi.org/10.6092/5346c32c-acd3-4534-800a-7947f5914315 Arctic Ocean - DIVA 4D 6-year analysis of Water body chlorophyll-a 1980/2017 v2018 https://doi.org/10.6092/28a025c3-1f79-4f6d-b71a-86641e2b7346 Black Sea - DIVA 4D 6-year analysis of Water body chlorophyll-a 1990/2016 v2018 https://doi.org/10.6092/3da98812-0b51-40ca-a95b-3f43de243c74 North East Atlantic Ocean - DIVA 4D 6-year analysis of Water body chlorophyll-a 1960/2017 v2018 https://doi.org/10.6092/ce474bda-7eba-11e8-84a3-40a8f051e8d0 North Sea - DIVA 4D 6-year analysis of Water body chlorophyll-a 1980/2017 v2018 https://doi.org/10.6092/d0e36bce-91d2-4baf-996d-2be3e16164f1 Baltic Sea - DIVA 4D 6-year analysis of Water body chlorophyll-a 1980/2016 v2018 https://doi.org/10.6092/66dcf80f-383c-4c70-842a-80eead8bd293
-
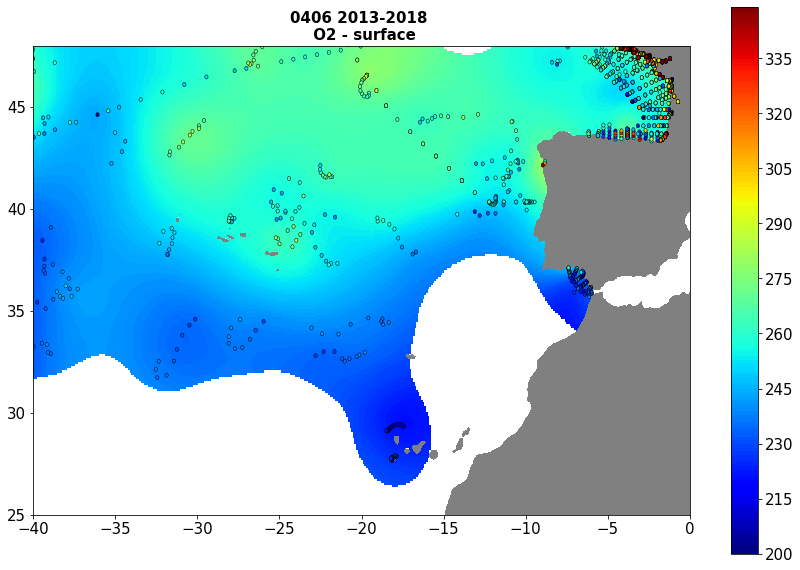
Moving 6-year analysis of Oxygen at Atlantic Sea for each season: - winter: January-March, - spring: April-June, - summer: July-September, - autumn: October-December. Every year of the time dimension corresponds to the 6-year centered average of each season. 6-year periods span from 1960-1965 until 2015-2020. Observational data span from 1960 to 2020. Depth range (IODE standard depths): -3000.0, -2500.0, -2000.0, -1750, -1500.0, -1400.0, -1300.0, -1200.0, -1100.0, -1000.0, -900.0, -800.0, -700.0, -600.0, -500.0, -400.0, -300.0, -250.0, -200.0, -150.0, -125.0, -100.0, -75.0, -50.0,-40.0, -30.0, -20.0, -10.0, -5.0, -0.0 Data Sources: observational data from SeaDataNet/EMODNet Chemistry Data Network. Description of DIVA analysis: Geostatistical data analysis by DIVA (Data-Interpolating Variational Analysis) tool. GEBCO 1min topography is used for the contouring preparation. Analyzed filed masked using relative error threshold 0.3 and 0.5 DIVA settings. Correlation length was optimized and filtered vertically and a seasonally-averaged profile was used. Signal to noise ratio was fixed to 1. Background field: the data mean value is subtracted from the data. Detrending of data: no, Advection constraint applied: no. Units: umol/l