 Metadata catalogue
The James Hutton Institute
Type of resources
Available actions
Topics
INSPIRE themes
Keywords
Contact for the resource
Provided by
Years
Formats
Representation types
Update frequencies
status
Service types
Scale
Resolution
-
The map shows the vulnerability of subsoils to compaction by traffic. It covers most of Scotland’s cultivated agricultural land area. The subsoil compaction risk gives information on the likelihood of the subsoil becoming compacted due to heavy machinery in four classes (Extremely vulnerable, Very vulnerable, Moderately vulnerable or Not particularly vulnerable) based on the soil texture and the amount of water left in the soil after any excess has drained away (known as field capacity).
-
The map shows the risk of the topsoil becoming compacted due to the passage of machinery. This map primarily covers the cultivated land in Scotland and provides information on the risk of topsoil compaction.The topsoil compaction risk gives information of the likelihood of the topsoil becoming compacted in 3 classes: High, Moderate or Low. The risk is based on the natural drainage class of the soil and the soil texture.
-
The map shows the risk of potential pollutants and nutrients leaching through the soil to ground and surface waters. This map primarily covers the cultivated land in Scotland. The soil leaching potential gives information on the likelihood of a potential pollutant that is applied to the soil surface infiltrating the soil and leaching to a water course or ground water in three main categories (High, Intermediate and Low) with the High class being subdivided into 3 classes while the intermediate class is subdivided into 2 classes. Note: soils over current and restored mineral workings and in urban areas that are often disturbed or absent are assumed to have little ability to retain potential pollutants and so are classified as having a high leaching potential (see Lewis, M.A., Lilly, A and J.S. Bell. 2000. Groundwater vulnerability mapping in Scotland: Modifications to classification used in England and Wales. In: Groundwater in the Celtic Regions: Studies in Hard Rock and Quaternary Hydrogeology. Eds. N.S. Robins and B.D.R. Misstear Geological Society Special Publication No. 182. pp 71-79.).
-
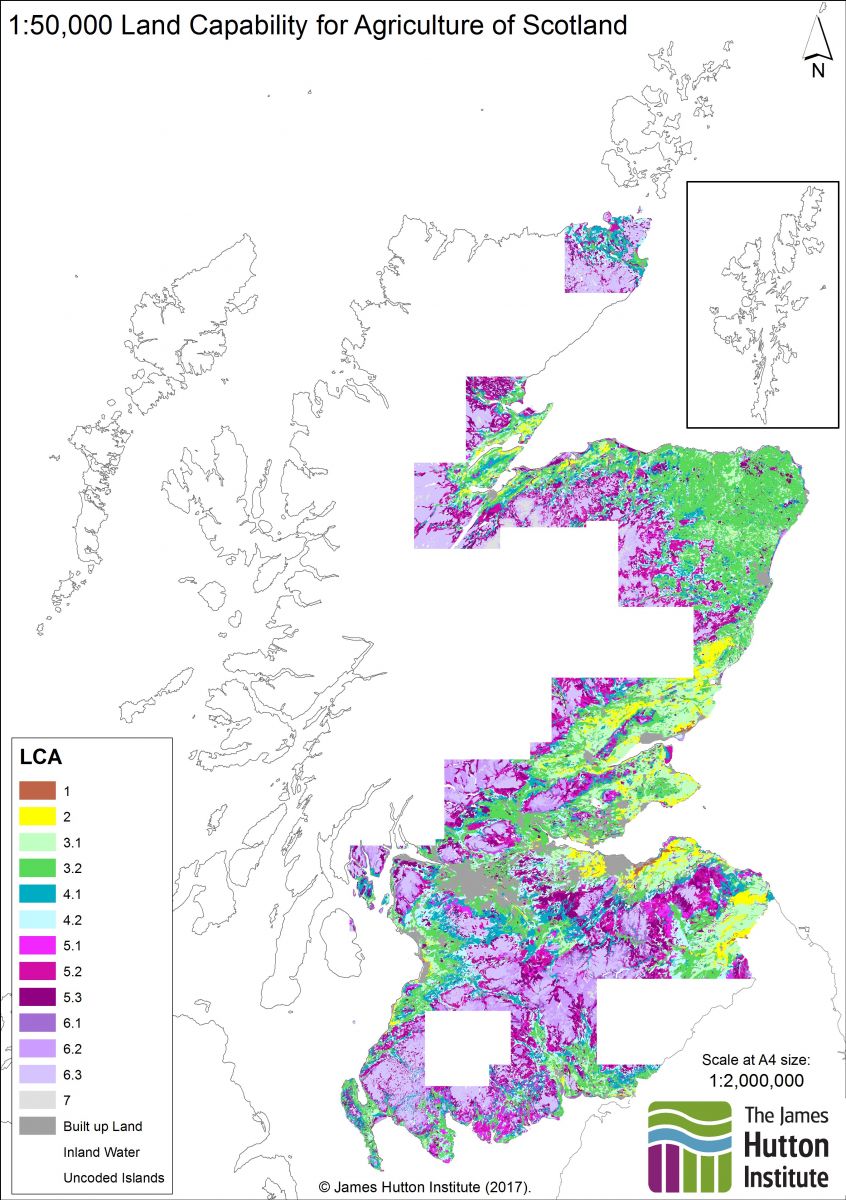
The Land Capability Classification for Agriculture has as its objective the presentation of detailed information on soil, climate and relief in a form which will be of value to land use planners, agricultural advisers, farmers and others involved in optimising the use of land resources. The classification ranks land on the basis of its potential productivity and cropping flexibility determined by the extent to which its physical characteristics (soil, climate and relief) impose long term restrictions on its agricultural use. THE CLASSES Class 1. Land capable of producing a very wide range of crops with high yields Class 2. Land capable of producing a wide range of crops with yields less high than Class 1. Class 3. Land capable of producing good yields from a moderate range of crops. Class 4. Land capable of producing a narrow range of crops. Class 5. Land suited only to improved grassland and rough grazing. Class 6. Land capable only of use as rough grazing. Class 7. Land of very limited agricultural value. THE DIVISIONS A division is a ranking within a class. As the requirements of the crops suited to Classes 1 and 2 are fairly stringent, land in these classes has inherently low degrees of internal variability and no divisions are present. The requirements of crops grown in the remaining classes are less rigorous, consequently land included is more variable in character.
-
The map shows the risk of water flowing overland (runoff) carrying potential pollutants into water courses. This map primarily covers the cultivated land in Scotland. The digital dataset gives information on the likelihood of a potential pollutant applied to the soil surface running off the land to a water course in 3 classes: Low, Moderate or High and is based on fundamental soil characteristics such as depth to a slowly permeable layer, soil porosity and flow pathways through the soil.
-
The map shows the risk of a bare soil being eroded by water under intense or prolonged rainfall and primarily covers the cultivated land in Scotland. Soils with mineral topsoils have been classified separately from those with organic (peaty) surface layers. The risk of soil erosion is shown in 3 main classes for soils with mineral topsoils; High, Moderate or Low. The risk of erosion is greatest on coarse textured soils with a low water adsorption capacity on steep slopes. Each main class is divided into 3 subclasses (H1-3, M1-3 and L1-3) with the greater numbers in each risk class indicating a higher risk of erosion due to increases in slope, soil textures becoming more coarse and/or the soils having a lesser ability to absorb rainfall. The risk of soil erosion for soils with organic (peaty) surfaces is also shown in 3 classes; High, Moderate or Low. The Moderate and Low erosion risk classes are divided into subclasses (Mi–iv and Li-iii) with the greater numbers (i-iv) in each risk class indicating a higher risk of erosion due to increases in slope and/or the soils having a lesser ability to absorb rainfall.
-
The proportion of water held in the soil at field capacity (5KPa) and at the permanent wilting point (1500kPa) was calculated for each soil horizon of each soil taxonomic unit (soil series) delineated within the 1:250 000 national soil map of Scotland based on pedotransfer functions (regression equations using median sand, silt, clay and organic carbon contents from the Scottish soils knowledge and information base (SSKIB) derived for soils in the UK (Hollis et al., 2015). The Available Water Content for each horizon was calculated by subtracting the water content at 1500 KPa from the water content at 5 kPa. The horizon thickness was then multiplied by the available water content (mm) and summed for the entire soil profile to 1 m or rock if <1m. The map shows the average available water capacity calculated using the areal proportions of all soils in each 1:250 000 soil map unit. Gagkas, Z., Lilly, A., Baggaley, N. & Donnelly, D. (2019). Map of available water capacity of soils in Scotland. James Hutton Institute. Aberdeen. Please note that this dataset differs significantly to the version of Available Water Capacity published in 2012. The difference results from the use of different regression equations to predict available water capacities (Hollis et al.) and bulk densities. In addition, the data values shown are weighted averages by polygon rather than the AWC of the dominant soil type in the polygon. The earlier version of AWC was published as Lilly, A, Baggaley, N and Donnelly, D. 2012. Map of available water content to 1 metre depth in soils of Scotland. Map prepared for EU project GS-SOIL-Assessment and strategic development of INSPIRE compliant Geodata-Services for European Soil Data. ECP-2008-GEO-318004.
-
This service is the digital (vector) version of the Land Capability for Agriculture of Scotland 1:50,000 maps. Also known as "Land capability for agriculture (partial cover)". Refer to the datasets for more information.
-
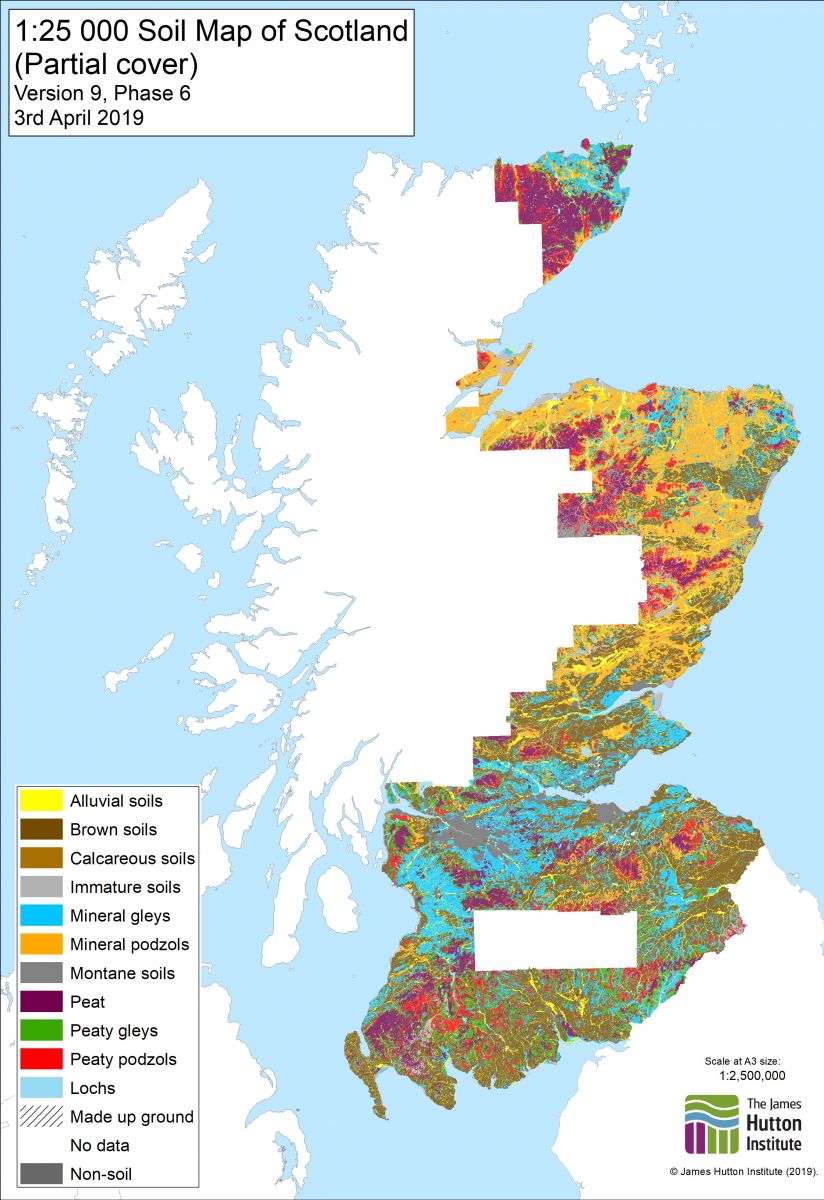
This is the digital dataset which was created by digitising the Soils of Scotland 1:25,000 Soil maps and the Soils of Scotland 1:25,000 Dyeline Masters. The Soils of Scotland 1:25,000 Soil maps were the source documents for the production of the Soils of Scotland 1:63,360 and 1:50,000 published map series. The classification is based on Soil Associations, Soil Series and Phases which reflect parent material, major soil group, and soil sub-groups, drainage and (for phases), texture, stoniness, land use, rockiness, topography and organic matter. Phases are not always mapped. In general terms this dataset primarily covers the cultivated land of Scotland but also includes some upland areas . Not all of the available source documents have been digitised. Should there be a requirement for other areas to be captured, the Internal Contact should be contacted in the first instance. Attribute definitions: The attributes on each map (coverage) are specific to that map sheet, but in general terms the following categories are mapped: soil association, soil series, parent material, soil complexes, soil phases, skeletal soils, alluvial soils, organic soils, miscellaneous soils, mixed bottom land, built-up area, quarries/disturbed ground, collieries/bings, golf courses.
-

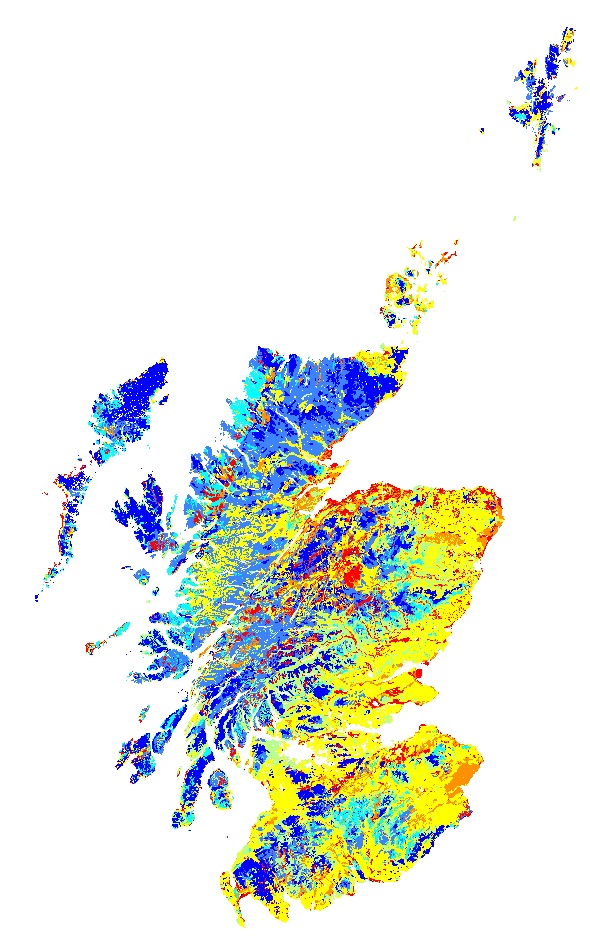
This service is the digital (vector) version of the Land Capability for Agriculture of Scotland 1:250,000 maps. Refer to the datasets for more information.