 Metadata catalogue
Swedish Meteorological and Hydrological Institute
Type of resources
Available actions
Topics
INSPIRE themes
Keywords
Contact for the resource
Provided by
Years
Formats
Representation types
Resolution
-
Water body chlorophyll-a - Seasonal Climatology for Gulf of Riga for the period 1994-2019 on the domain: Lon 22.3-25.0°E, Lat 56.8-58.4°N. Data Sources: observational data from SeaDataNet/EMODnet Chemistry Data Network. Description of DIVA analysis: The computation was done with the DIVAnd (Data-Interpolating Variational Analysis in n dimensions), version 2.7, using GEBCO 30sec topography for the spatial connectivity of water masses. Horizontal correlation length of 25 km and vertical correlation length of 10 m. Depth range: 0.0, 2.5, 5, 10, 15, 20, 25, 30, 40, 50 m. Units: mg/m3. The horizontal resolution of the produced DIVAnd maps grids is 0.01 degrees.
-
Water body silicate - Seasonal Climatology for Gulf of Riga for the period 1994-2019 on the domain: Lon 22.3-25.0°E, Lat 56.8-58.4°N. Data Sources: observational data from SeaDataNet/EMODnet Chemistry Data Network. Description of DIVA analysis: The computation was done with the DIVAnd (Data-Interpolating Variational Analysis in n dimensions), version 2.7, using GEBCO 30sec topography for the spatial connectivity of water masses. Horizontal correlation length of 25 km and vertical correlation length of 10 m. Depth range: 0.0, 2.5, 5, 10, 15, 20, 25, 30, 40, 50 m. Units: µmol/l. The horizontal resolution of the produced DIVAnd maps grids is 0.01 degrees.
-
Water body dissolved inorganic nitrogen (DIN) - Seasonal Climatology for Gulf of Riga for the period 1994-2019 on the domain: Lon 22.3-25.0°E, Lat 56.8-58.4°N. Data Sources: observational data from SeaDataNet/EMODnet Chemistry Data Network. Description of DIVA analysis: The computation was done with the DIVAnd (Data-Interpolating Variational Analysis in n dimensions), version 2.7, using GEBCO 30sec topography for the spatial connectivity of water masses. Horizontal correlation length of 25 km and vertical correlation length of 10 m. Depth range: 0.0, 2.5, 5, 10, 15, 20, 25, 30, 40, 50 m. Units: µmol/l. The horizontal resolution of the produced DIVAnd maps grids is 0.01 degrees.
-
Water body dissolved oxygen concentration - Seasonal Climatology for Gulf of Riga for the period 1994-2019 on the domain: Lon 22.3-25.0°E, Lat 56.8-58.4°N. Data Sources: observational data from SeaDataNet/EMODnet Chemistry Data Network. Description of DIVA analysis: The computation was done with the DIVAnd (Data-Interpolating Variational Analysis in n dimensions), version 2.7, using GEBCO 30sec topography for the spatial connectivity of water masses. Horizontal correlation length of 25 km and vertical correlation length of 10 m. Depth range: 0.0, 2.5, 5, 10, 15, 20, 25, 30, 40, 50 m. Units: µmol/l. The horizontal resolution of the produced DIVAnd maps grids is 0.01 degrees.
-
Water body phosphate - Seasonal Climatology for Gulf of Riga for the period 1994-2018 on the domain: Lon 22.3-25.0°E, Lat 56.8-58.4°N. Data Sources: observational data from SeaDataNet/EMODnet Chemistry Data Network. Description of DIVA analysis: The computation was done with the DIVAnd (Data-Interpolating Variational Analysis in n dimensions), version 2.7, using GEBCO 30sec topography for the spatial connectivity of water masses. Horizontal correlation length of 25 km and vertical correlation length of 10 m. Depth range: 0.0, 2.5, 5, 10, 15, 20, 25, 30, 40, 50 m. Units: µmol/l. The horizontal resolution of the produced DIVAnd maps grids is 0.01 degrees.
-

Units: umol/l. Method: spatial interpolation produced with DIVA (Data-Interpolating Variational Analysis). URL: http://modb.oce.ulg.ac.be/DIVA. Comment: Every year of the time dimension corresponds to a 10-year centred average for each season : - winter season (December-February), - spring (March-May), - summer (June-August), - autumn (September-November). Diva settings: Snr=1.0, CL=0.7
-

Units: umol/l. Method: spatial interpolation produced with DIVA (Data-Interpolating Variational Analysis). URL: http://modb.oce.ulg.ac.be/DIVA. Comment: Every year of the time dimension corresponds to a 10-year centred average for each season : - winter season (December-February), - spring (March-May), - summer (June-August), - autumn (September-November). Diva settings: Snr=1.0, CL=0.7.
-

Moving 6-year analysis of Water body ammonium in the Baltic Sea. Four seasons (March-May, June-August, September-November, December-February). Every year of the time dimension corresponds to the 6-year centred average. Periods span between 1980-1985 and 2011-2016. Analyses for depths (m) (HELCOM standard depths): 0, 5, 10, 15, 20, 30, 40, 50, 60, 70, 80, 90, 100, 125, 150, 175, 200, 225, 250, 275, 300. Data Sources: observational data from SeaDataNet/EMODnet Chemistry Data Network. Description of DIVA analysis: Geostatistical data analysis by DIVA (Data-Interpolating Variational Analysis) tool. GEBCO_08 Grid (30 arc-seconds) topography is used for the contouring preparation. Files contain analysed fields, error fields and combined field with the deepest value for each grid point selected. Also pre-masked fields using relative error threshold 0.3 and 0.5 are included. In the analyses the Correlation length and Signal to noise ratio were fixed to 0.7 and 1.0 respectively. Background fields were created using all data (1980-2016) for the given season. Log transformation (option 11) was used in the analyses. No detrending, advection constraints or weighting are applied. Unit is umol/l. The entire set of related maps can be found in the viewing service: http://ec.oceanbrowser.net/emodnet/ .
-
Moving 6-year analysis of Water body chlorophyll-a in the Baltic Sea. Four seasons (March-May, June-August, September-November, December-February). Every year of the time dimension corresponds to a 6-year centred average. Periods span between 1980-1985 and 2013-2018. Analyses for depths (m) (HELCOM standard depths): 0, 5, 10, 15, 20, 30, 40, 50, 60, 70, 80, 90, 100, 125, 150, 175, 200, 225, 250, 275, 300. Data Sources: observational data from SeaDataNet/EMODnet Chemistry Data Network. Description of DIVA analysis: Geostatistical data analysis by DIVA (Data-Interpolating Variational Analysis) tool. GEBCO Grid (30 arc-seconds) topography is used for the contouring preparation. Files contain analysed fields, error fields and combined field with the deepest value for each grid point selected. Also pre-masked fields using relative error threshold 0.3 and 0.5 are included. In the analyses the Correlation length in the horizontal direction were fixed to 80 km and in the vertical direction to 25 m. Signal to noise ratio were fixed to 1.0. Background fields were created using data for the given time period and season. Log transformation was used in the analyses. No detrending, advection constraints or weighting are applied. Unit is mg/m3.
-
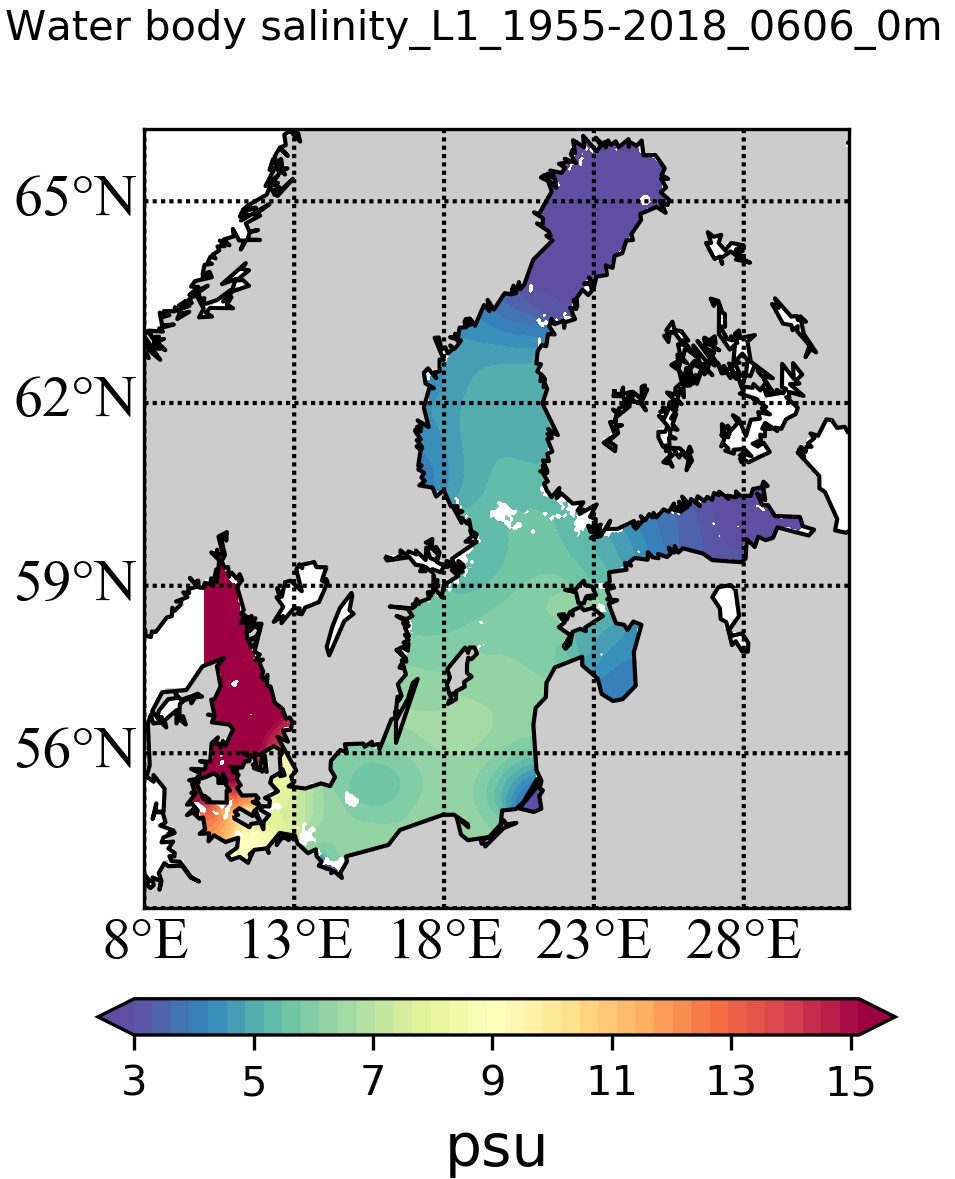
The SDC_BAL_CLIM_TS_V2 product contains temperature and salinity climatologies for the Baltic Sea, including seasonal and monthly fields for the period 1955-2018 and seasonal and monthly fields for 6 decades starting from 1955 to 2018. The climatological fields were computed from a merged Baltic Sea data set that combines data extracted from two major sources: 1) SeaDataNet infrastructure and 2) Coriolis Ocean Dataset for Reanalysis. The computation was done with the DIVAnd (Data-Interpolating Variational Analysis in n dimensions), version 2.6.3.