 Metadata catalogue
Scottish Office Agriculture Environment and Fisheries Department - Aberdeen Marine Laboratory
Type of resources
Available actions
Topics
INSPIRE themes
Keywords
Contact for the resource
Provided by
Years
Formats
Representation types
Resolution
-

Moving 6-year analysis of chlorophyll-a in the Arctic Region for each season: winter (December-February), spring (March-May), summer (June-August) and autumn (September-November). Every year of the time dimension corresponds to the 6-year centred average of each season. 6-year periods span from 1980-1985, 1981-1986, ....., until 2012-2017. Depth range (IODE standard depths): -300.0, -250.0, -200.0, -150.0, -125.0, -100.0, -75.0, -50.0,-40.0, -30.0, -20.0, -10.0, -5.0, -0.0. Data Sources: observational data from SeaDataNet/EMODnet Chemistry Data Network. Description of DIVA analysis: Geostatistical data analysis by DIVA (Data-Interpolating Variational Analysis) tool. GEBCO 1min topography is used for the contouring preparation. Analysed field masked using relative error threshold 0.3 and 0.5. DIVA settings: signal-to-noise ratio and correlation length were estimated using data mean distance as a minimum (for L) and vertically filtered. Background field: A reference field of all seasonal data between 1980-2017. Detrending of data: no. Advection constraint applied: no. Units: umol/l. The entire set of related maps can be found in the viewing service: http://ec.oceanbrowser.net/emodnet/ .
-
EMODnet Chemistry aims to provide access to marine chemistry data sets and derived data products concerning eutrophication, acidity and contaminants. The chemicals chosen reflect importance to the Marine Strategy Framework Directive (MSFD). This aggregated dataset contains all unrestricted EMODnet Chemistry data on Eutrophication and Acidity (14 parameters with quality flag indicators), and covers the Norwegian Sea, Barents Sea, Greenland Sea and Icelandic Waters with 114721 CDI stations. Data were aggregated and quality controlled by 'Institute of Marine Research - Norwegian Marine Data Centre (NMD)'. Regional datasets concerning eutrophication and acidity are automatically harvested and resulting collections are aggregated and quality controlled using ODV Software and following a common methodology for all Sea Regions ( https://doi.org/10.6092/9f75ad8a-ca32-4a72-bf69-167119b2cc12 ). When not present in original data, Water body nitrate plus nitrite was calculated by summing up the Nitrates and Nitrites. Same procedure was applied for Water body dissolved inorganic nitrogen (DIN) which was calculated by summing up the Nitrates, Nitrites and Ammonium. Parameter names are based on P35, EMODnet Chemistry aggregated parameter names vocabulary, which is available at: https://www.bodc.ac.uk/resources/vocabularies/vocabulary_search/P35/ Detailed documentation is available at: https://dx.doi.org/10.6092/4e85717a-a2c9-454d-ba0d-30b89f742713 Explore and extract data at: https://emodnet-chemistry.webodv.awi.de/eutrophication>Arctic The aggregated dataset can also be downloaded as ODV collection and spreadsheet, which is composed of metadata header followed by tab separated values. This spreadsheet can be imported to ODV Software for visualisation (More information can be found at: https://www.seadatanet.org/Software/ODV ) The original datasets can be searched and downloaded from EMODnet Chemistry Download Service: https://emodnet-chemistry.maris.nl/search
-

EMODnet Chemistry aims to provide access to marine chemistry data sets and derived data products concerning eutrophication, acidity and contaminants. The chemicals chosen reflect importance to the Marine Strategy Framework Directive (MSFD). This aggregated dataset contains all unrestricted EMODnet Chemistry data on Eutrophication and Acidity (14 parameters with quality flag indicators), and covers the Norwegian Sea, Barents Sea, Greenland Sea and Icelandic Waters with 220031 CDI stations. Data were aggregated and quality controlled by 'Institute of Marine Research - Norwegian Marine Data Centre (NMD)'. Regional datasets concerning eutrophication and acidity are automatically harvested and resulting collections are aggregated and quality controlled using ODV Software and following a common methodology for all Sea Regions ( https://doi.org/10.6092/9f75ad8a-ca32-4a72-bf69-167119b2cc12 ). When not present in original data, Water body nitrate plus nitrite was calculated by summing up the Nitrates and Nitrites. Same procedure was applied for Water body dissolved inorganic nitrogen (DIN) which was calculated by summing up the Nitrates, Nitrites and Ammonium. Parameter names are based on P35, EMODnet Chemistry aggregated parameter names vocabulary, which is available at: https://www.bodc.ac.uk/resources/vocabularies/vocabulary_search/P35/ Detailed documentation is available at: https://doi.org/10.6092/ec8207ef-ed81-4ee5-bf48-e26ff16bf02e The aggregated dataset can be downloaded as ODV spreadsheet, which is composed of metadata header followed by tab separated values. This worksheet can be imported to ODV Software for visualisation (More information can be found at: https://www.seadatanet.org/Software/ODV ) The original datasets can be searched and downloaded from EMODnet Chemistry Download Service: https://emodnet-chemistry.maris.nl/search
-

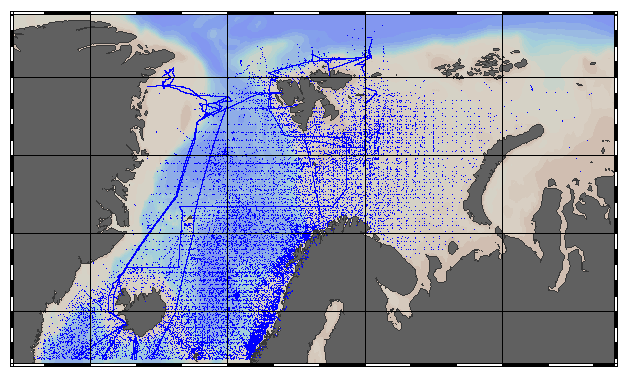
The data collection of the North Sea is divided in two datasets : the discrete collection and the trajectories collection. The Discrete SeaDataCloud Temperature and Salinity Historical Data Collection for the North Sea includes open access in situ data on temperature and salinity measured with “discrete” instruments (CTD, XBT, discrete water samplers…). The data span between 4°W and 10°E in longitude, and from 49°N to 62°N in latitude. It covers the time period 1893 – 2017. The data were retrieved from the SeaDataNet infrastructure in November 2017. The “Trajectories” SeaDataCloud Temperature and Salinity Historical Data Collection for the North Sea includes open access in situ data on temperature and salinity measured by continuously recording sensors (e.g. Ferryboxes). The data span between 4°W and 10°E in longitude, and from 49°N to 62°N in latitude. It covers the time period 1989 – 2017. The data were retrieved from the SeaDataNet infrastructure in November 2017. The quality control of the data has been performed with the help of ODV software. Data Quality Flags have been revised following common recommended procedures defined under SeaDataNet 2 project in conjunction with visual expert check. The dataset format is ODV binary collections. You can read, analyse and export from the ODV application provided by Alfred Wegener institute at http://odv.awi.de/. For data access please register at http://www.marine-id.org/.
-
The analysis was performed per season using DIVA software tool (Data-Interpolating Variational Analysis). The analyses products are stored as NetCDF CF files and made available as WMS layers for easy browsing and adding. Every step of the time dimension corresponds to a 6-year moving average from 1983 to 2016. The depth dimension spans from surface to 1000 m, with 21 vertical levels. The boundaries and overlapping zones between these regions were filtered to avoid any unrealistic spatial discontinuities. This combined water body dissolved oxygen concentration product is masked using the relative error threshold 0.5. Units: µmol/l Created by 'University of Liège, GeoHydrodynamics and Environment Research (ULiège-GHER)'. The data used as input for DIVA have been extracted from the EMODnet Chemistry Download Service: https://emodnet-chemistry.maris.nl/search Intermediate regional data products: Mediterranean Sea - DIVA 4D 6-year analysis of Water body chlorophyll-a 1990/2017 v2018 https://doi.org/10.6092/5346c32c-acd3-4534-800a-7947f5914315 Arctic Ocean - DIVA 4D 6-year analysis of Water body chlorophyll-a 1980/2017 v2018 https://doi.org/10.6092/28a025c3-1f79-4f6d-b71a-86641e2b7346 Black Sea - DIVA 4D 6-year analysis of Water body chlorophyll-a 1990/2016 v2018 https://doi.org/10.6092/3da98812-0b51-40ca-a95b-3f43de243c74 North East Atlantic Ocean - DIVA 4D 6-year analysis of Water body chlorophyll-a 1960/2017 v2018 https://doi.org/10.6092/ce474bda-7eba-11e8-84a3-40a8f051e8d0 North Sea - DIVA 4D 6-year analysis of Water body chlorophyll-a 1980/2017 v2018 https://doi.org/10.6092/d0e36bce-91d2-4baf-996d-2be3e16164f1 Baltic Sea - DIVA 4D 6-year analysis of Water body chlorophyll-a 1980/2016 v2018 https://doi.org/10.6092/66dcf80f-383c-4c70-842a-80eead8bd293
-

Combined product of Water body chlorophyll a based on DIVA 4D 10-year analysis on five regions : Northeast Atlantic Ocean, North Sea, Baltic Sea, Black Sea, Mediterranean Sea. The boundaries and overlapping zones between these five regions were filtered to avoid any unrealistic spatial discontinuities. This combined Water body chlorophyll a product is masked using the relative error threshold 0.5. Units: mg/m^3. Created by 'University of Liege, GeoHydrodynamics and Environment Research (ULg-GHER)'.
-
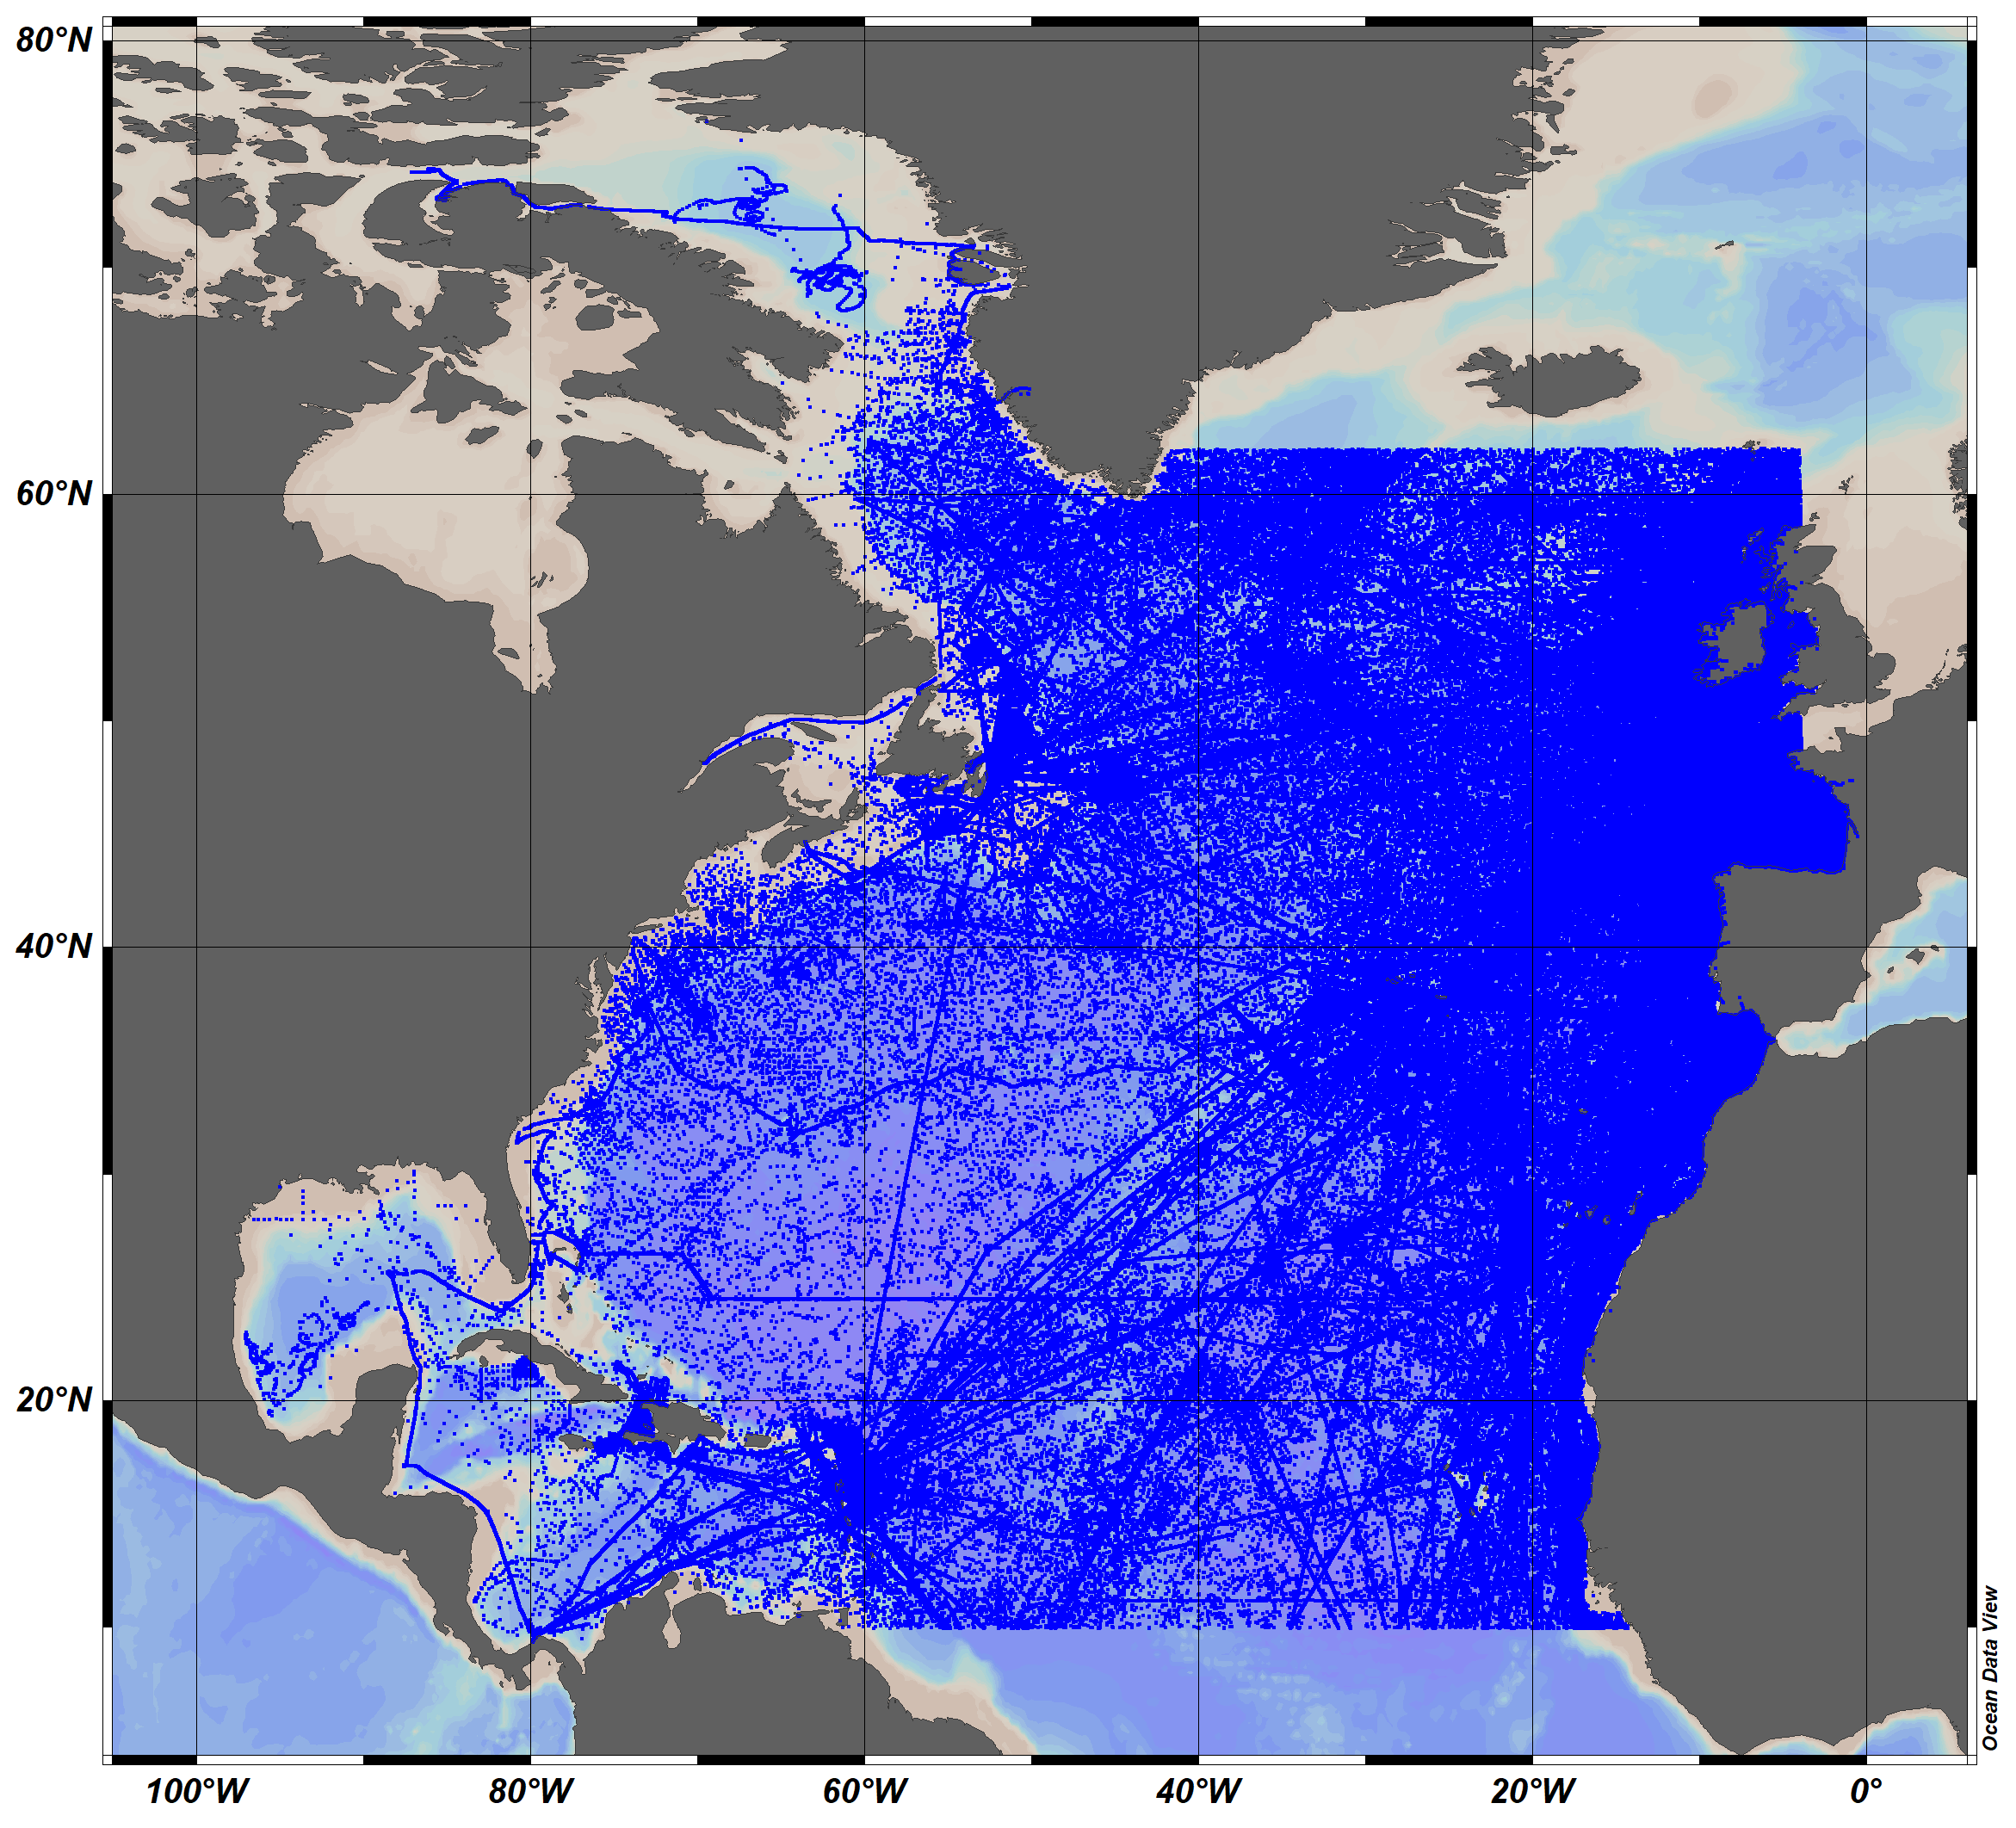
The SeaDataCloud TS historical data collection V2 for the North Atlantic Ocean, includes open access in situ data on temperature and salinity of water column in the North Atlantic Ocean from 10°N to 62°N, including the Labrador Sea, The data were retrieved from the SeaDataNet infrastructure at summer 2019. The dataset format is Ocean Data View (ODV - http://odv.awi.de/) binary collection. The quality control of the data has been performed with the help of ODV software. Data Quality Flags have been revised and set up using the elaborated by SeaDataNet2 project QC procedures in conjunction with the visual expert check. The final number of the Temperature and Salinity profiles (stations) in the collection is 10119755. For data access please register at http://www.marine-id.org/.
-
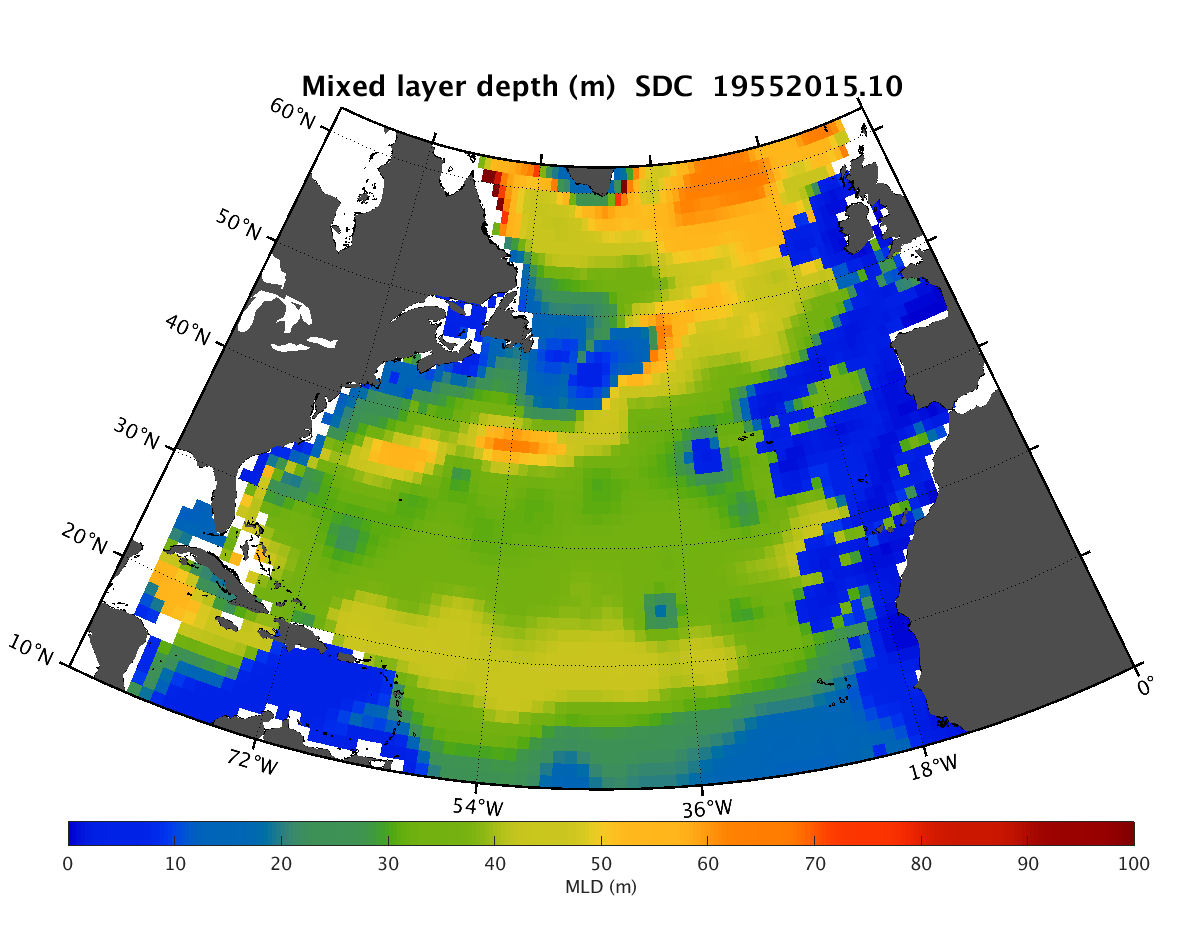
The SDC_NAT_DP1 product contains the North Atlantic Ocean monthly climatology for mixed layer depth (MLD) based on temperature climatology spanning 60 years (1955-2015). The MLD fields have spatial resolution 1/4°. The profiles of temperature combines data from 2 major sources, the SeaDataNet infrastructure and a part of data of the Coriolis Ocean Dataset for Reanalysis (CORA). The used climatology is the SeaDataCloud North Atlantic Ocean Temperature Climatology V1 (https://doi.org/10.13155/61810) done with the DIVA software, version 4.7.2. The product was developed in framework of the SeaDataCloud project. This product must be considered as feasibility study for the next phases, it is a beta-version and that further research needs to be done before its usage from users.
-
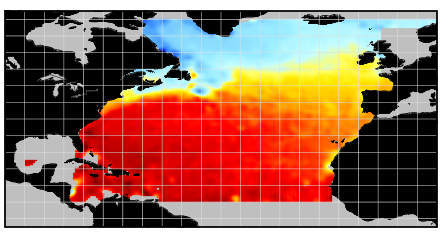
The SDC_NAT_CLIM_TS_V2 product contains Temperature and Salinity Climatologies for the North Atlantic Ocean including the seasonal and monthly fields for 7 decades starting from 1950 to 2019. One resolution has been processed : 1/2°. The climatic fields were computed from the integrated North Atlantic Ocean dataset that combines data extracted from the 2 major sources: SeaDataNet infrastructure and Coriolis Ocean Dataset for Reanalysis (CORA). The computation was done with the DIVAnd software.
-
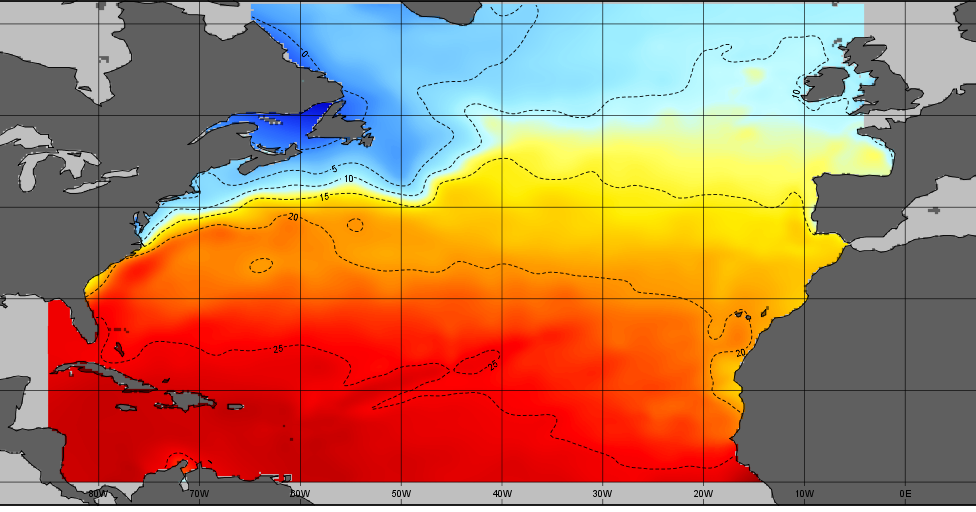
The SDC_NAT_CLIM_TS_V1 product contains Temperature and Salinity Climatologies for the North Atlantic Ocean including the seasonal and monthly fields for period 1955-2015 and seasonal fields for 6 decades starting from 1955 to 2015. Two resolutions have been processed : 1/2° and 1/4°. The climatic fields were computed from the integrated North Atlantic Ocean dataset that combines data extracted from the 2 major sources: SeaDataNet infrastructure and Coriolis Ocean Dataset for Reanalysis (CORA). The computation was done with the DIVA software, version 4.7.2.