 Metadata catalogue
SEADATANET
Type of resources
Available actions
Topics
INSPIRE themes
Keywords
Contact for the resource
Provided by
Years
Formats
Representation types
Resolution
-
SeaDataNet est une infrastructure distribuée de gestion des données marines connectée aux centres de données des pays bordant les mers européennes. SeaDataNet met à disposition des données d’observations in-situ archivées dans ces divers centres de données. Ces données sont essentiellement des données de Physique/Chimie, de Géosciences ou de Biologie. Les données de SeaDataNet sont accessibles à des formats homogènes et standardisés quel que soit le centre de données dont elles proviennent. Elles répondent à des standards de qualité appliqués par tous les centres de données connectés à l’infrastructure. L'accès en ligne aux données in situ et aux métadonnées est assuré par un portail unique reliant les plates-formes interopérables constituées par les centres de données de l’infrastructure.
-
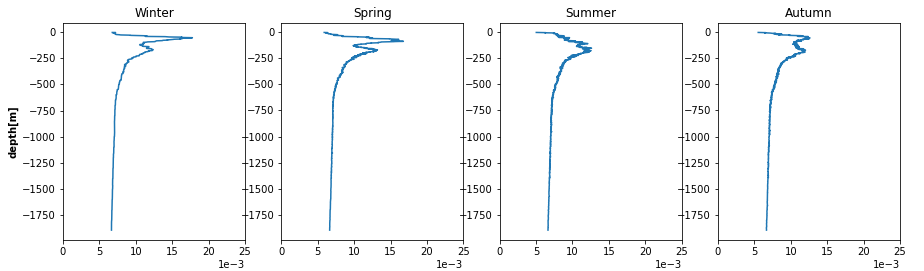
The SDC_GLO_CLIM_N2 product contains seasonally averaged Brunt-Vaisala squared frequency profiles using the density profiles computed in SeadataCloud Global Ocean Climatology - Density Climatology. The Density Climatology product uses the Profiling Floats (PFL) data from World Ocean database 18 for the time period 2003 to 2017 with a Nonlinear Quality procedure applied on it. Computed BVF profiles are averaged seasonally into 5x5 degree boxes for Atlantic and Pacific Oceans. For data access, please register at http://www.marine-id.org/.
-
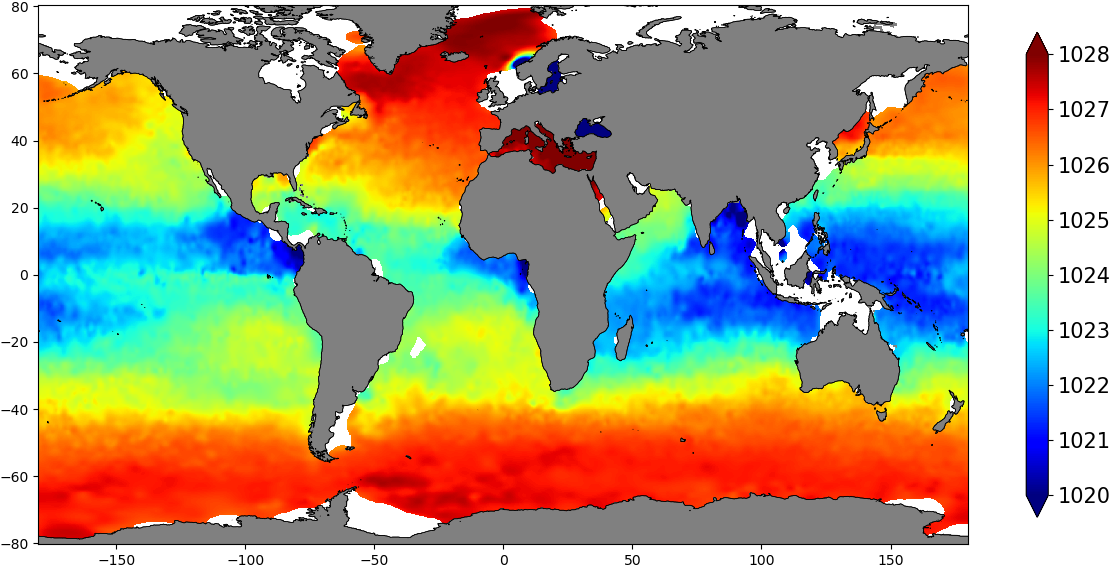
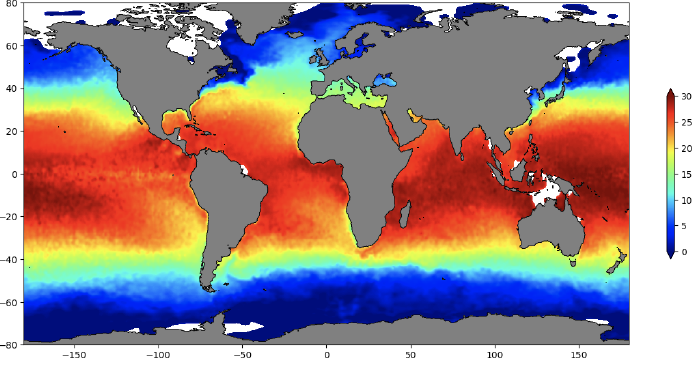
The SDC_GLO_CLIM_Dens product contains global monthly climatological estimates of in situ density using Temperature and Salinity from profiling floats contained in the World Ocean Data 18 (WOD18) database. The profiles were first quality controlled with a Nonlinear Quality control procedure. The climatology considers observations from surface to 2000 m for the time period 2003-2017. Density profiles are computed using UNESCO 1983 (EOS 80) equation from in situ temperature, salinity and pressure measurements by the PFL. Only profiles with both T,S values were used. The gridded fields are computed using DIVAnd (Data Interpolating Variational Analysis) version 2.3.1.
-
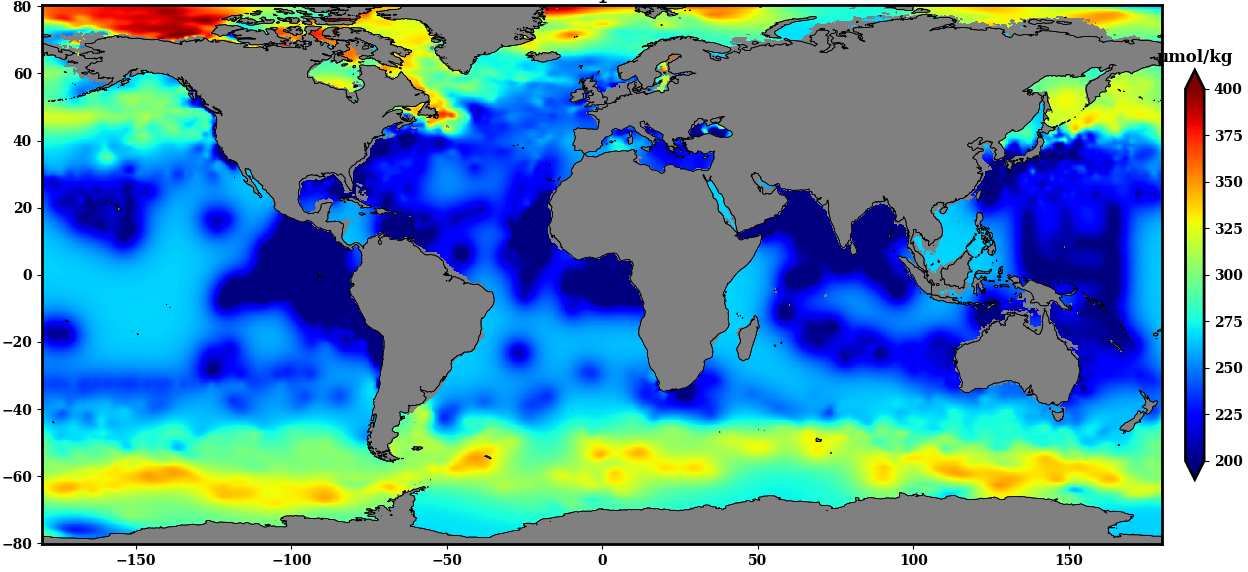
The SDC_GLO_CLIM_O2_AOU product contains two different monthly climatology for dissolved Oxygen and Apparent Oxygen Utilization, SDC_GLO_CLIM_O2 and SDC_GLO_CLIM_AOU respectively from the World Ocean Data (WOD) database. Only basic quality control flags from the WOD are used. The first climatology, SDC_GLO_CLIM_O2, considers Dissolved Oxygen profiles casted together with temperature and salinity from CTD, Profiling Floats (PFL) and Ocean Station Data (OSD) for time duration 2003 to 2017. The second climatology, SDC_GLO_CLIM_AOU, apparent Oxygen utilization, is computed as a difference of dissolved oxygen and saturation O2 profiles. The gridded fields are computed using DIVAnd (Data Interpolating Variational Analysis) version 2.3.1.
-
The SDC_GLO_CLIM_TS_V2 product is an improved version of SDC_GLO_CLIM_TS_V1 and contains two different monthly climatologies for temperature and salinity from the World Ocean Data 2018 (WOD-18) database. Along with the basic quality control flags from the WOD-18, an additional quality Control named Nonlinear Quality Control (NQC) is applied. The first climatology, V2_1, considers temperature and salinity profiles from Conductivity Depth Temperature (CTD), Ocean station data (OSD) and Moored buoy data (MRB) along with Profiling Floats (PFL) from 1900 to 2017. The second climatology, V2_2, utilizes only PFL data from 2003 to 2017. V2_1 considers 44 layers from surface to 6000 m while V2_2 only 34 from 0 to 2000 m. The gridded fields are computed using DIVAnd (Data Interpolating Variational Analysis) version 2.3.1. For data access, please register at http://www.marine-id.org/.
-

SeaDataNet Temperature and Salinity historical data collection for the North Arctic Ocean, including revised quality flags after quality control with ODV. For data access please register at http://www.marine-id.org The dataset format is ODV binary collections. You can read, analyse and export from the ODV application provided by Alfred Wegener institute at http://odv.awi.de/
-
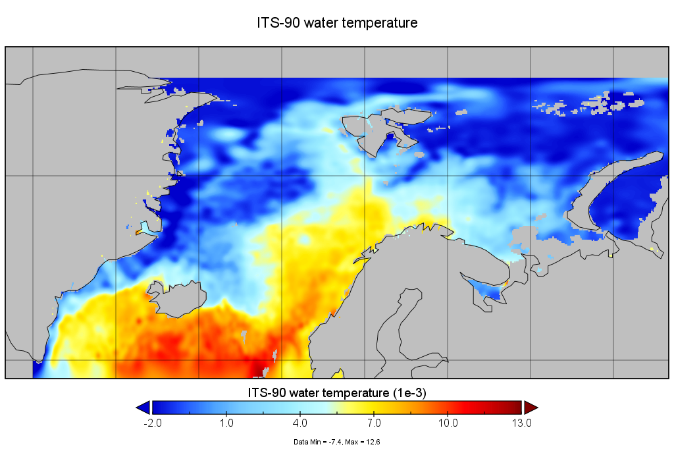
The SeaDataCloud Temperature and Salinity Climatologies have been processed from the historical Data Collection of the Arctic Ocean (from 56°N to 83°N and from 45°W to 70°E) including temperature and salinity in situ data of the water column for the period 1955 – 2019. The analysis was run in six decadal periods (1955-1964/1965-1974/1975-1984/1985-1994/1995-2004/2005-2014). A subset of the World Ocean Database 2018 (WOD18, https://www.nodc.noaa.gov/OC5/WOD/pr_wod.html) dataset has been integrated as external data-source to improve data availability for analysis.
-
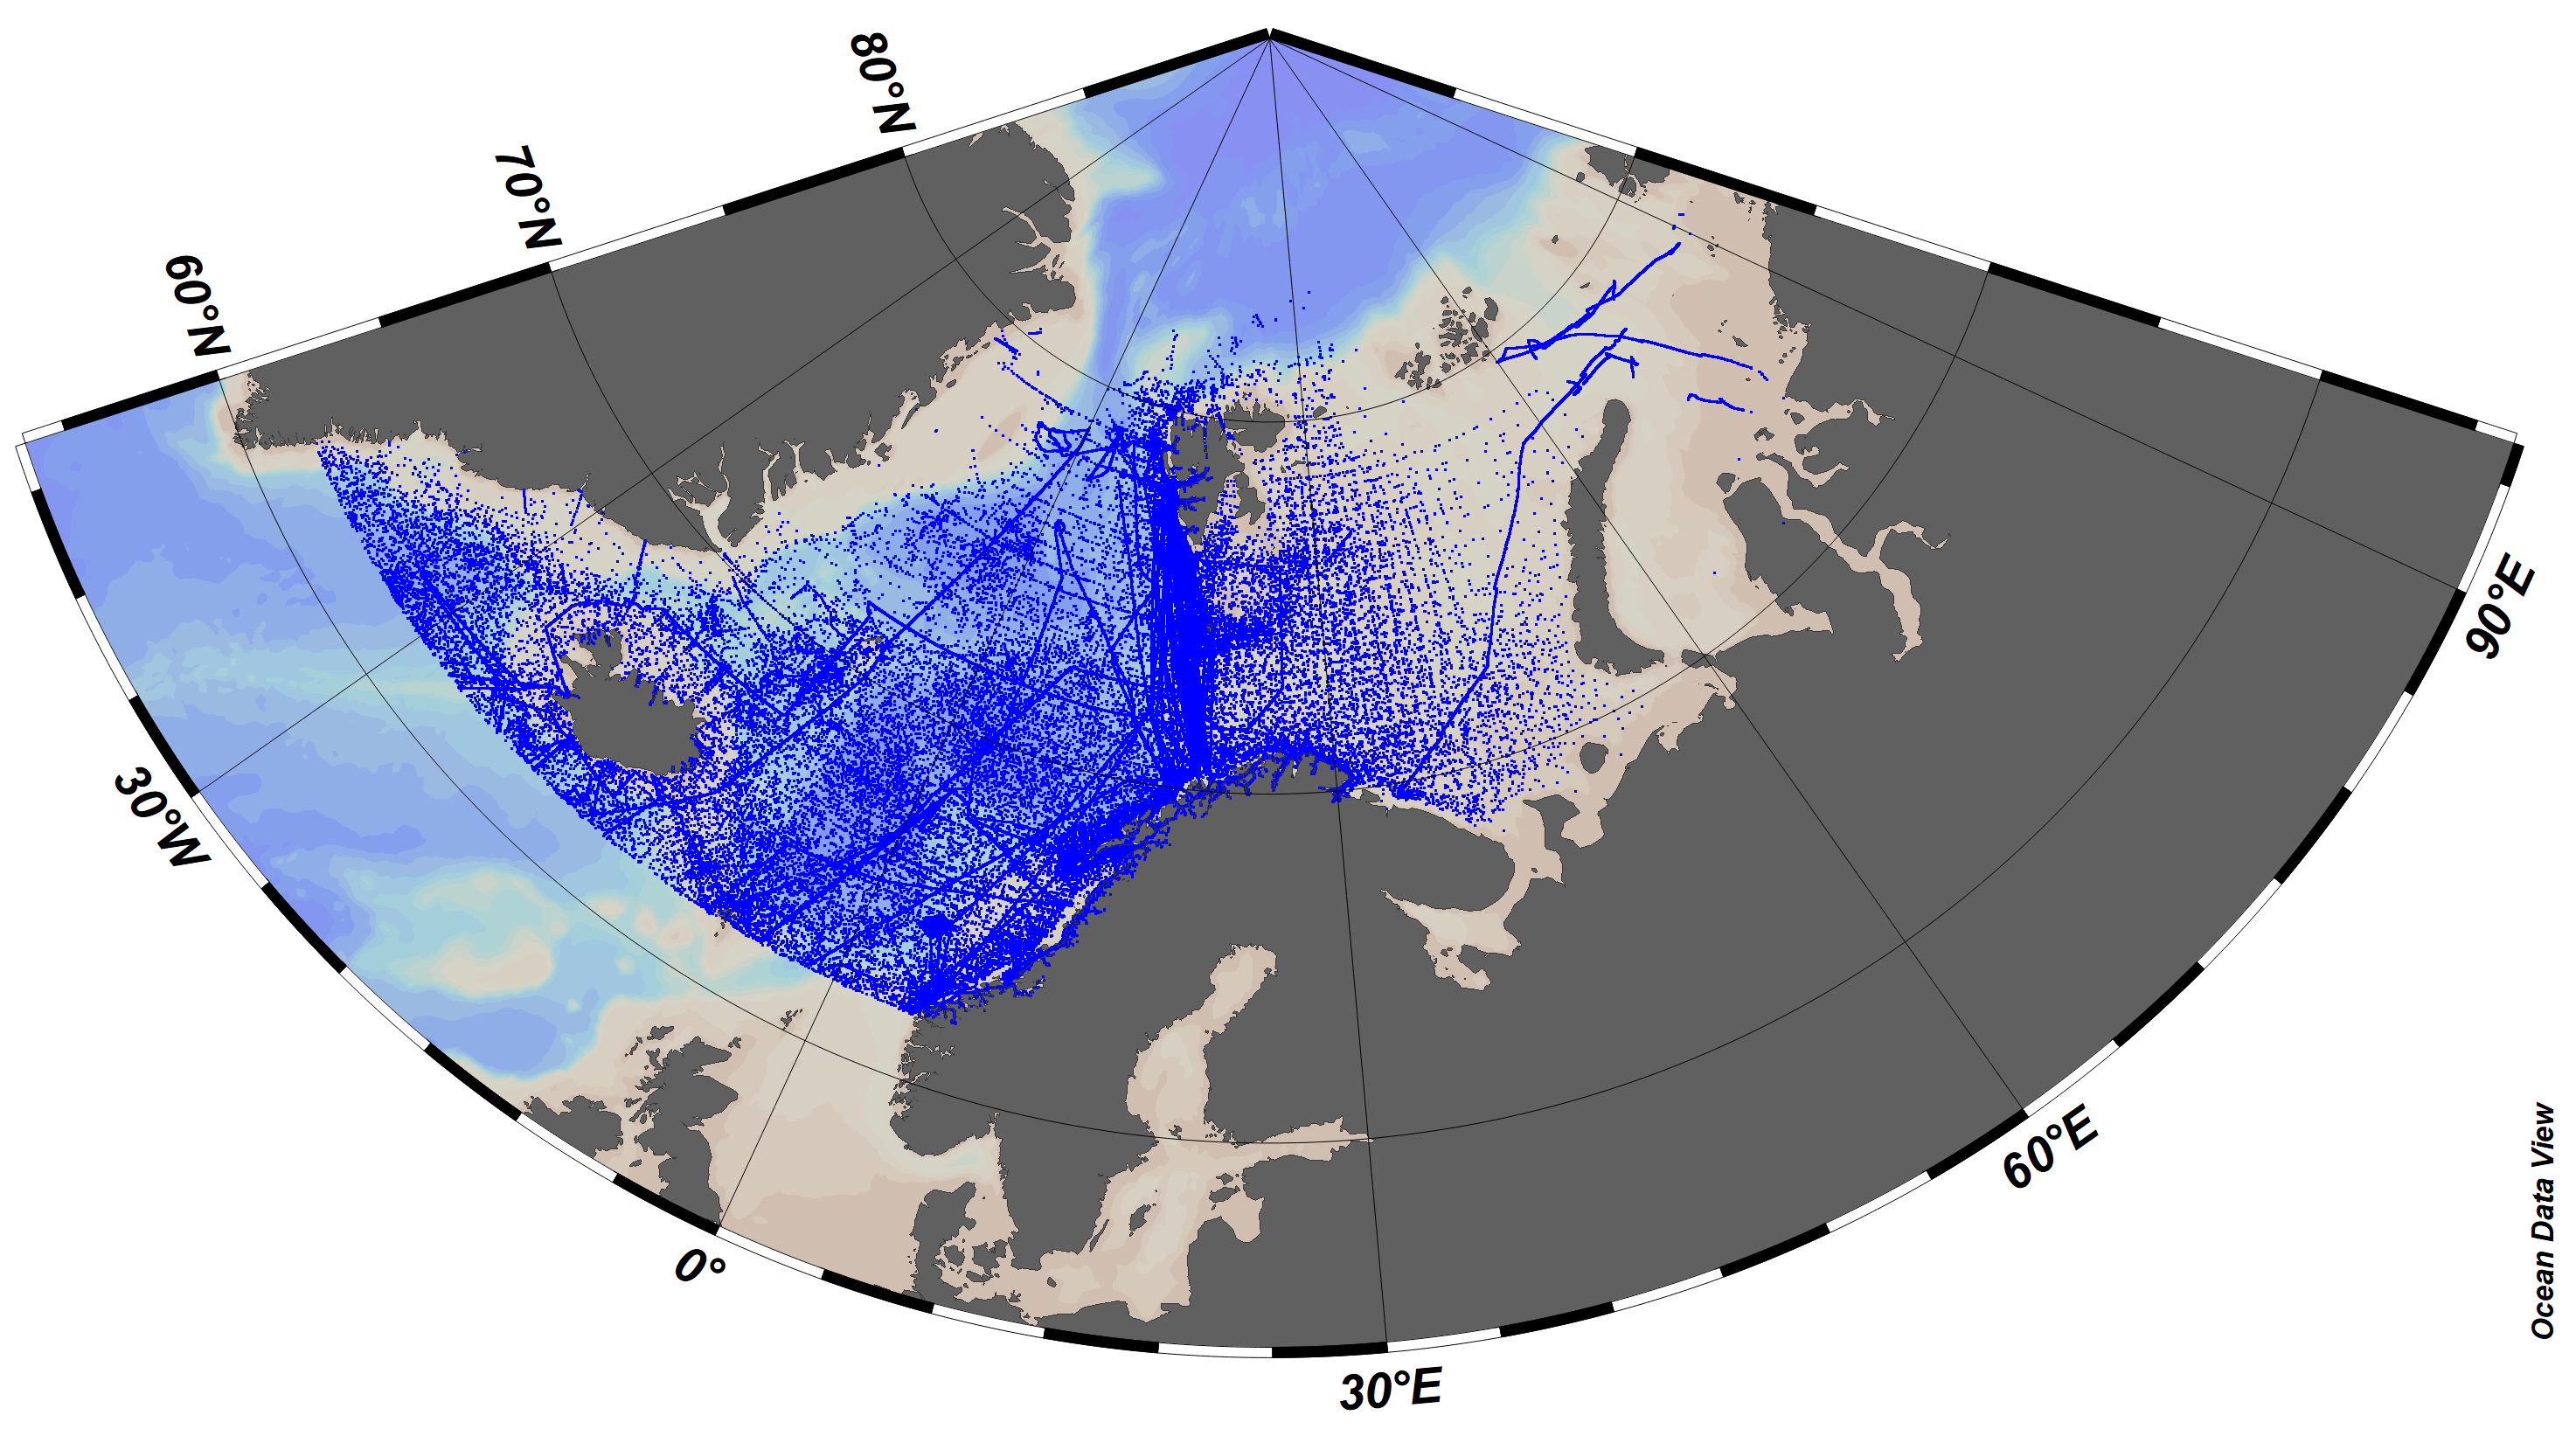
SeaDataCloud Temperature and Salinity historical data collection for the Arctic Ocean, including revised quality flags after quality control with ODV. The dataset format is ODV binary collections. You can read, analyse and export from the ODV application provided by Alfred Wegener institute at http://odv.awi.de/. For data access please register at http://www.marine-id.org/.
-
The SDC_BLS_CLIM_TS_V2 product contains Temperature and Salinity Climatologies for Black Sea including the seasonal and monthly fields for period 1955-2019 and seasonal fields for 6 decades starting from 1955 to 2019. The climatic fields were computed from the integrated Black Sea dataset that combines data extracted from the 3 major sources: 1) SeaDataNet infrastructure, 2) World Ocean Database, and 3) Coriolis Ocean Dataset for Reanalysis. The computation was done with the DIVAnd (Data-Interpolating Variational Analysis in n dimensions), version 2.6.4.
-
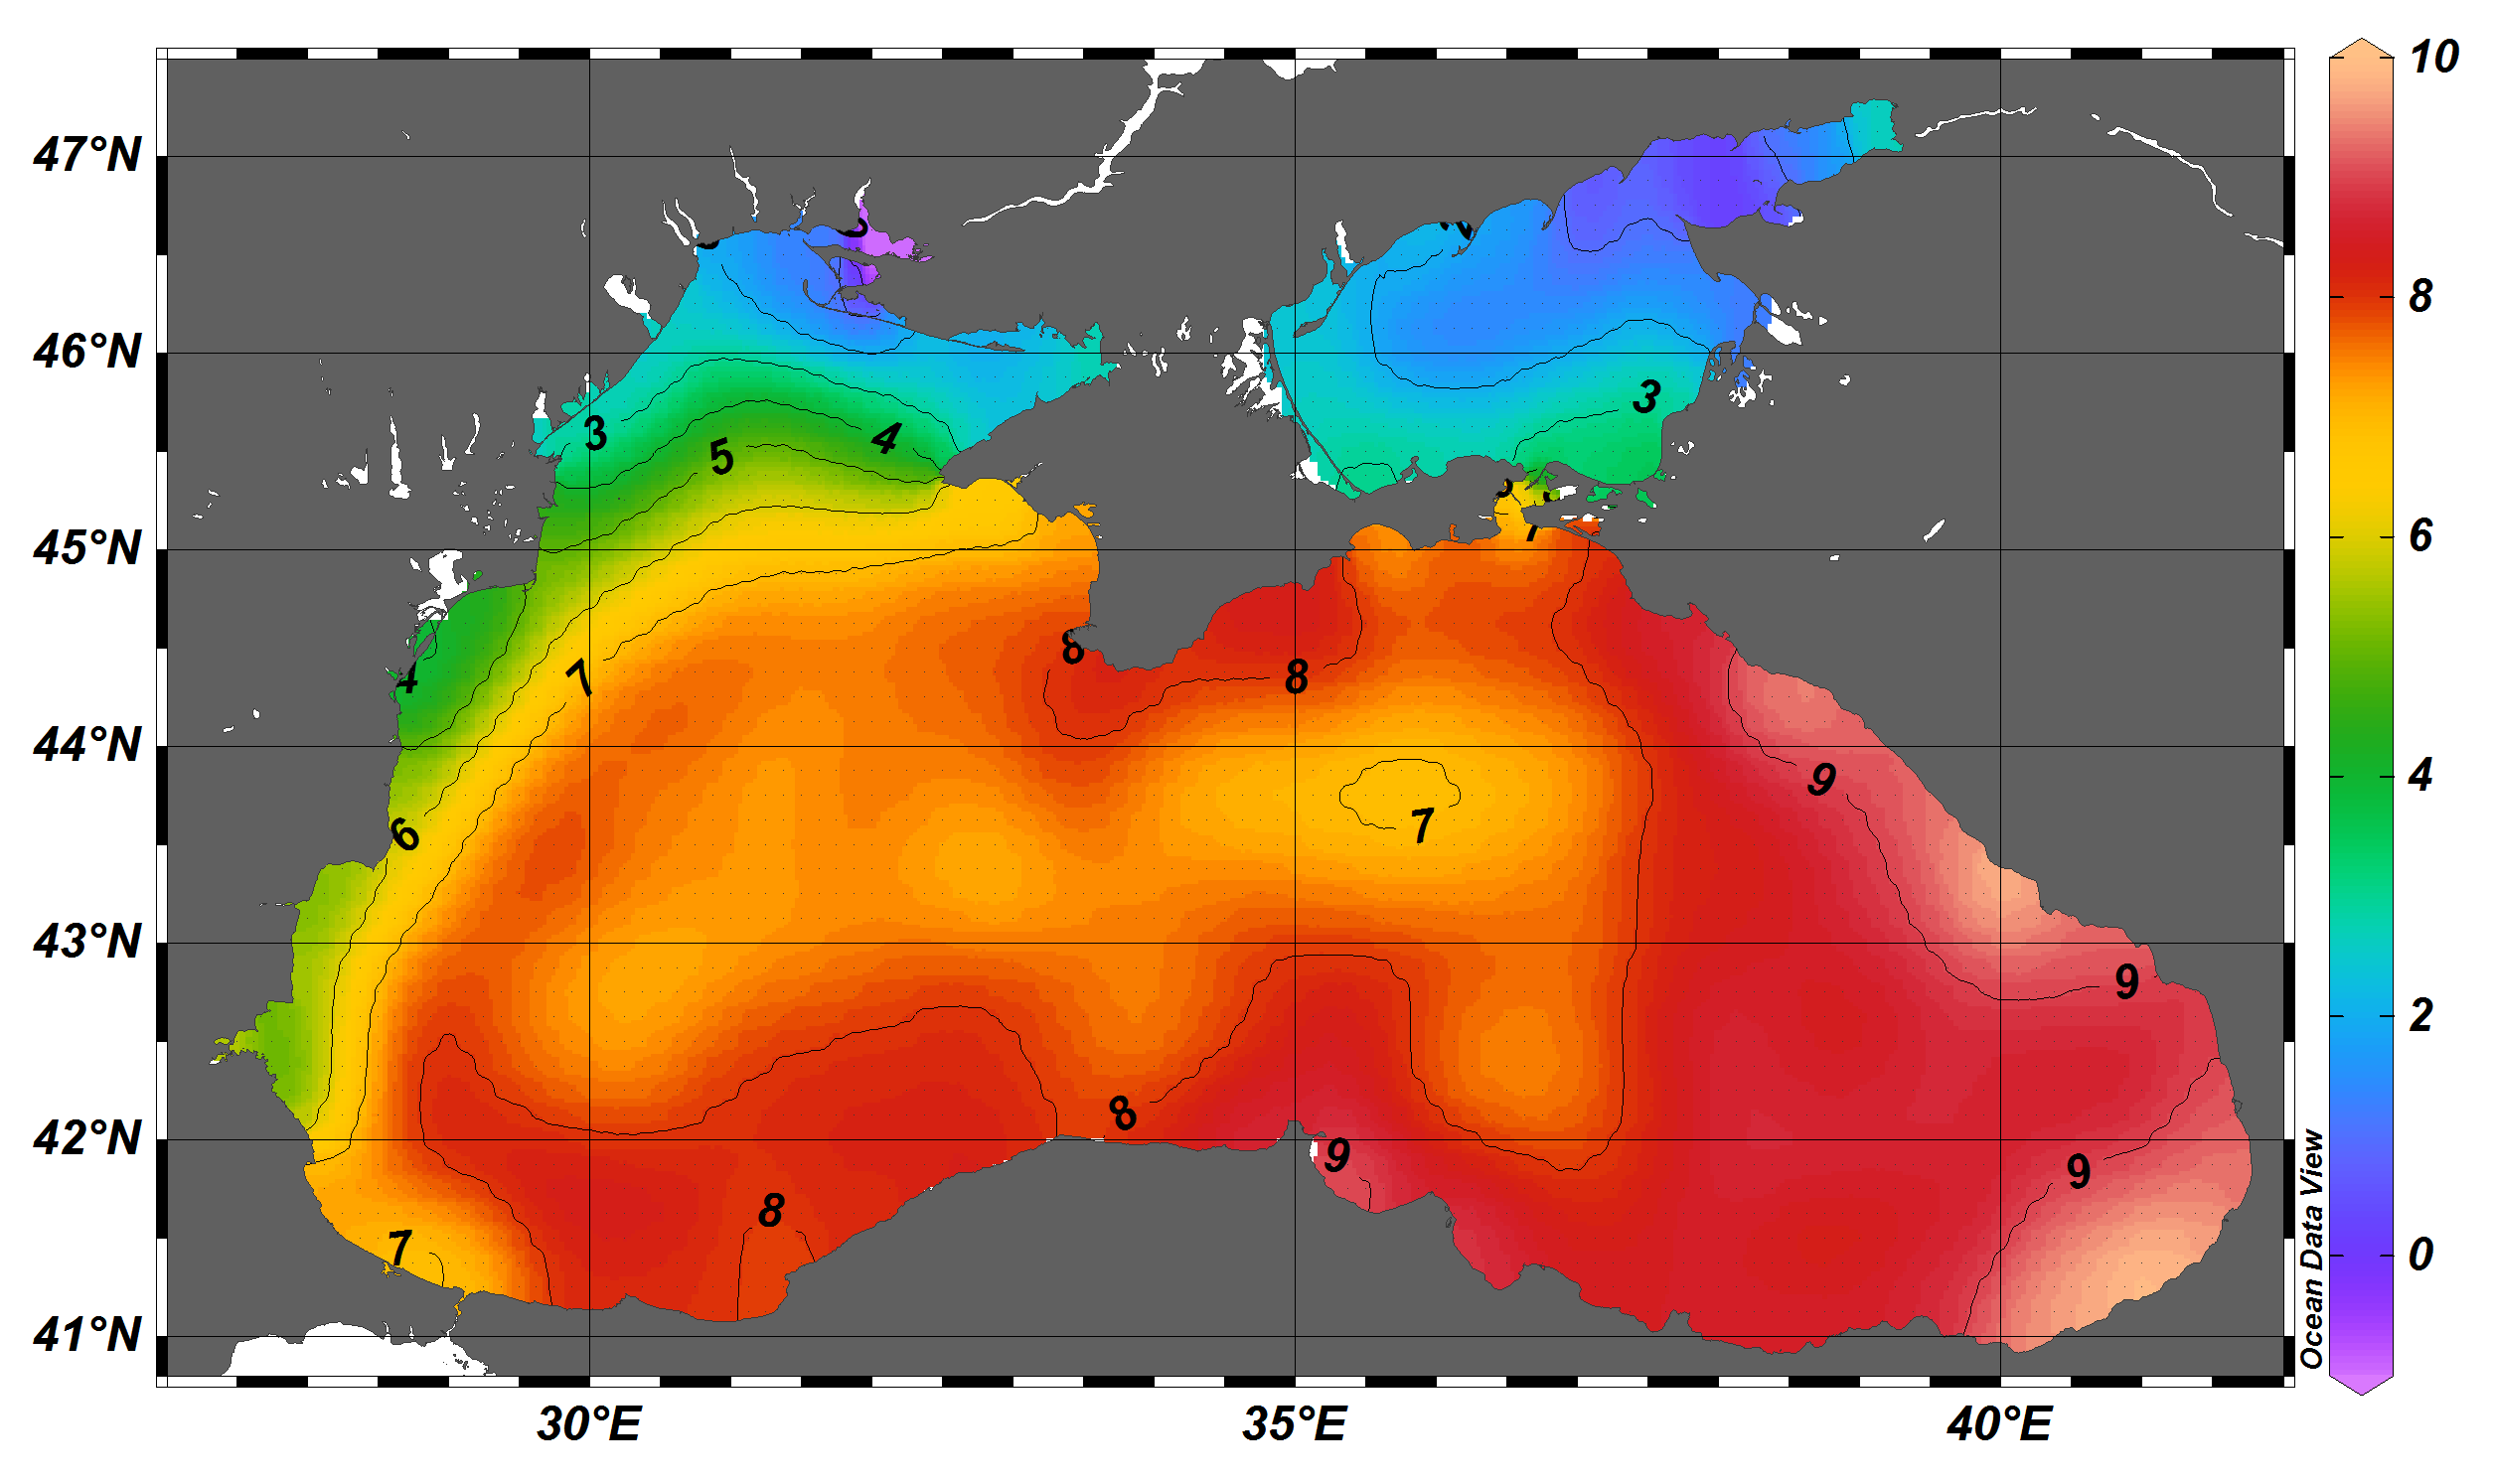
The SDC_BLS_CLIM_TS_V1 product contains Temperature and Salinity Climatologies for Black Sea including the seasonal and monthly fields for period 1955-2017 and seasonal fields for 6 decades starting from 1955 to 2014. The climatic fields were computed from the integrated Black Sea dataset that combines data extracted from the 3 major sources: 1) SeaDataNet infrastructure, 2) World Ocean Database 2018, and 3) Coriolis Ocean Dataset for Reanalysis. The computation was done with the DIVAnd (Data-Interpolating Variational Analysis in n dimensions), version 2.3.1.