 Metadata catalogue
P.P.Shirshov Institute of Oceanology, RAS
Type of resources
Available actions
Topics
INSPIRE themes
Keywords
Contact for the resource
Provided by
Years
Formats
Representation types
Scale
Resolution
-
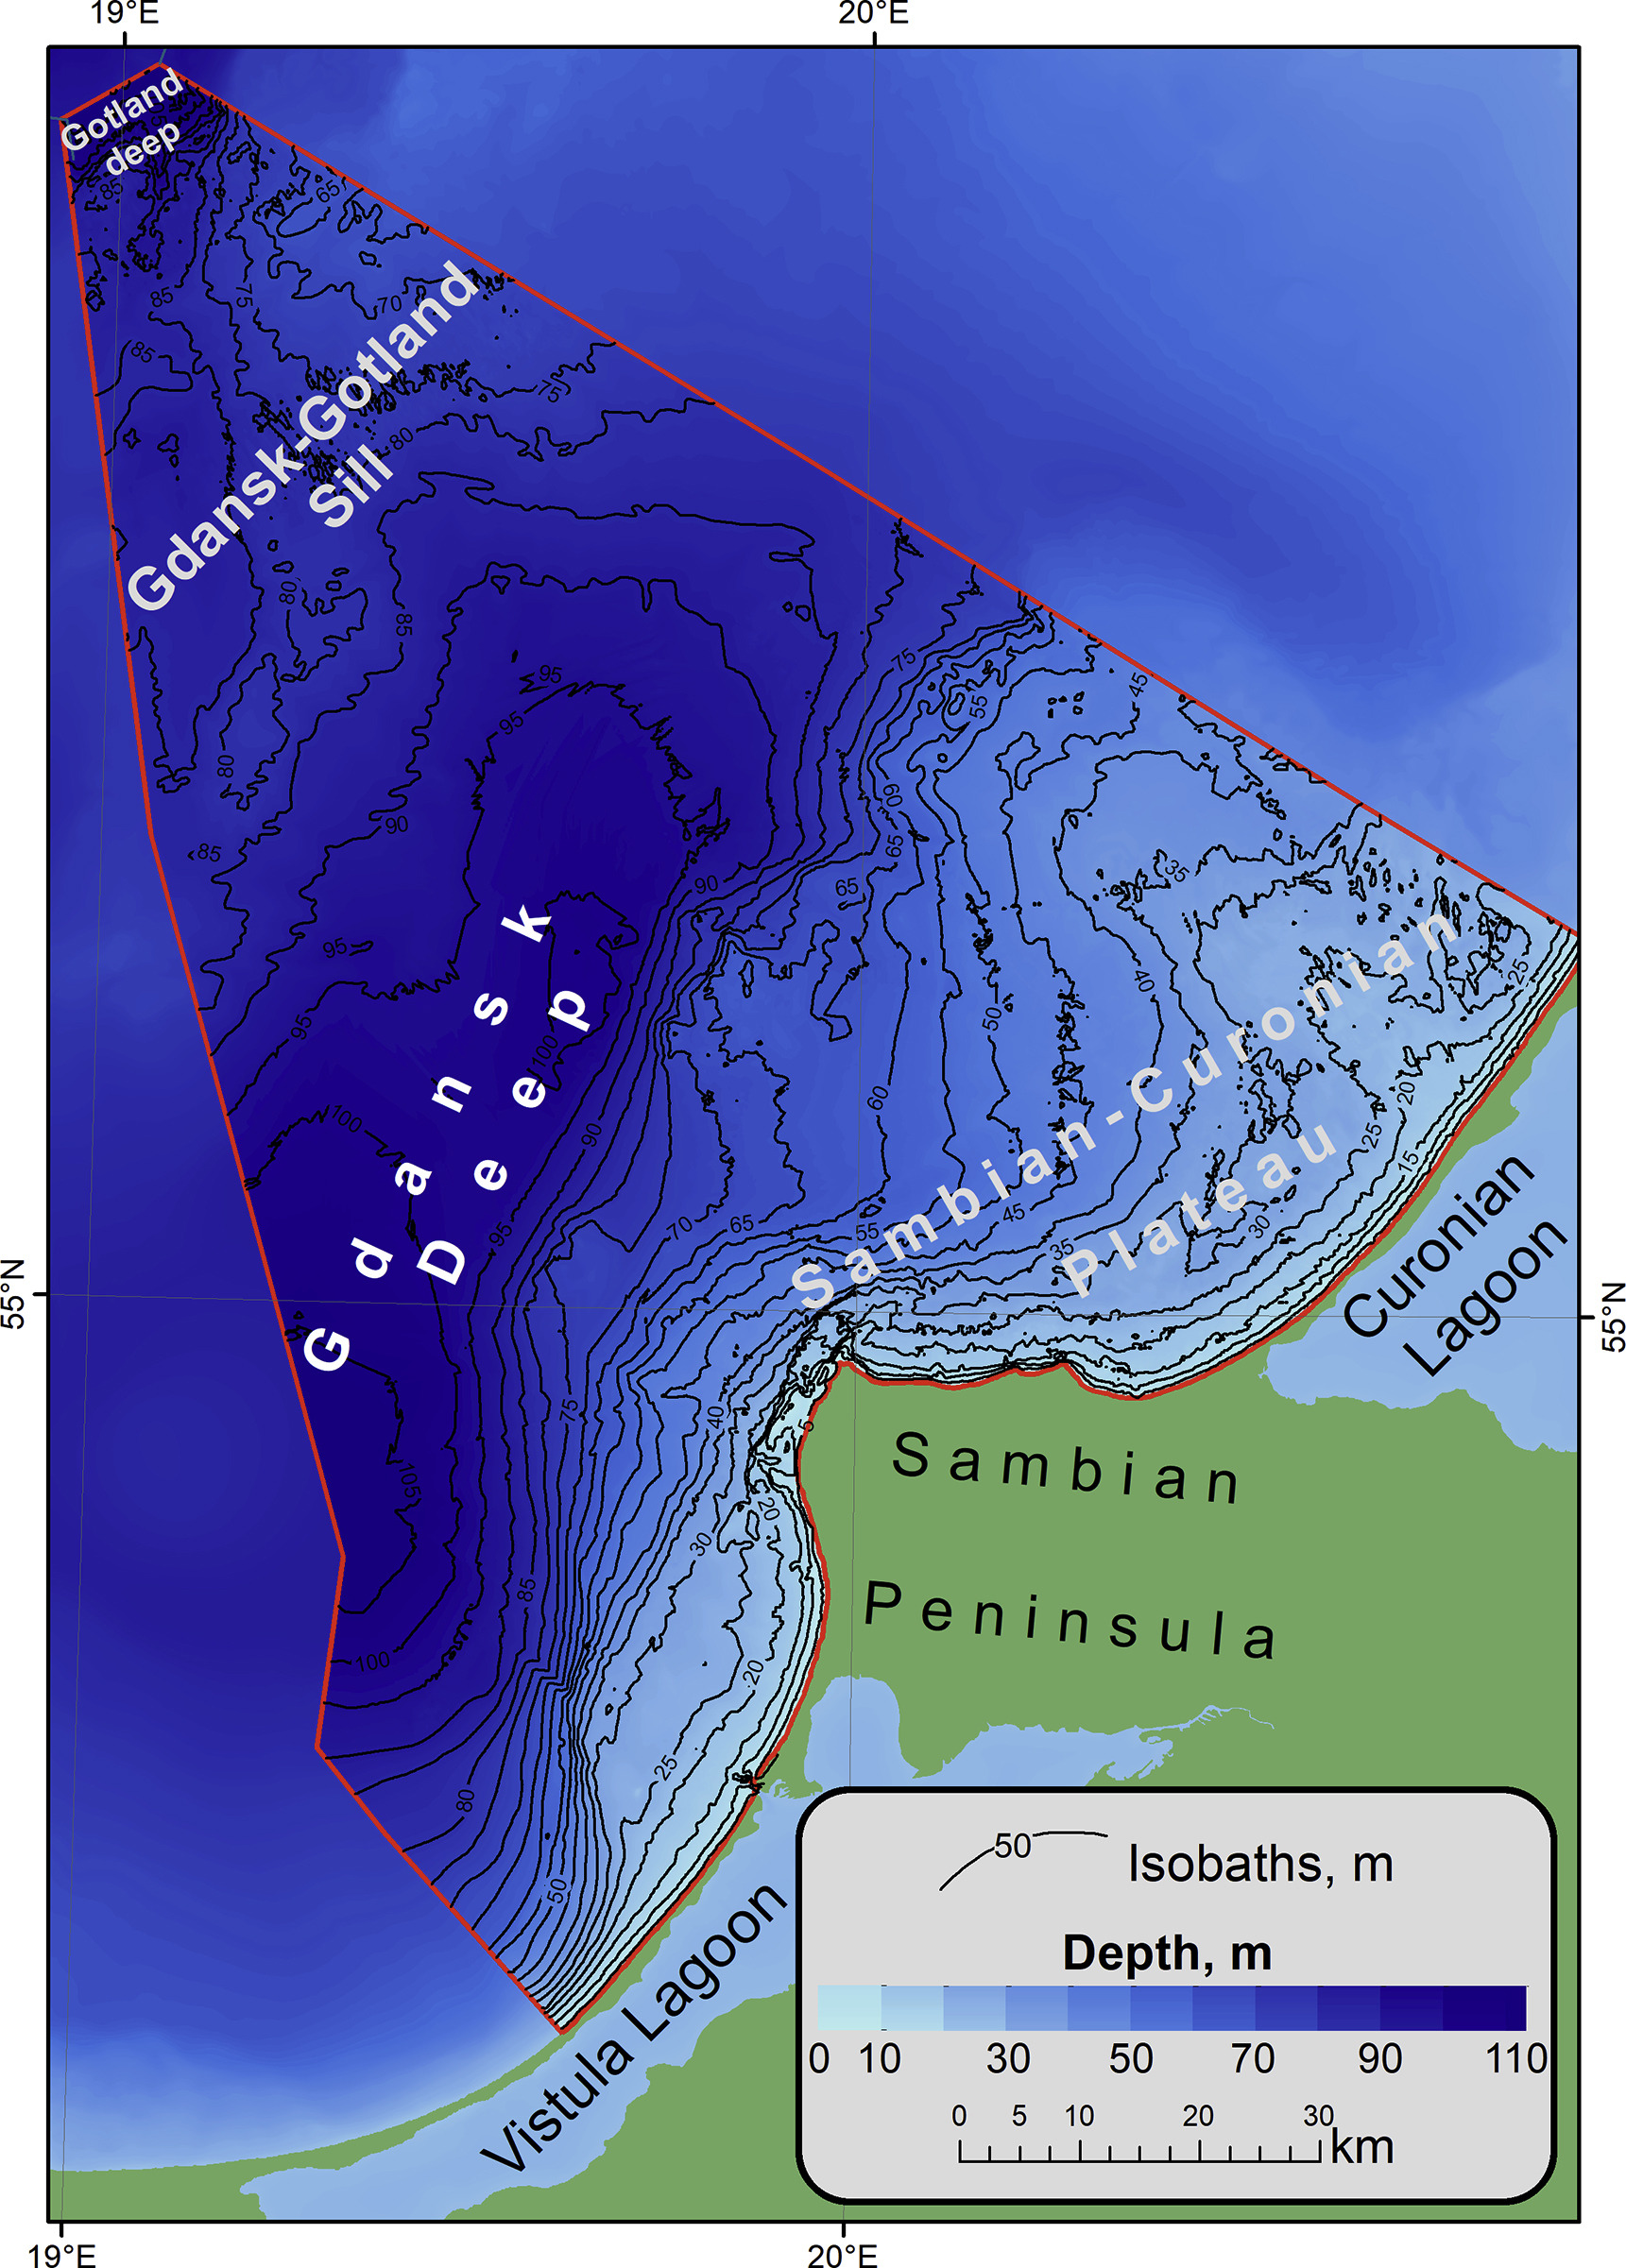
The bathymetric dataset of a single beam sounding. Surveys were conducted in 25 expeditions of the Atlantic branch of Shirshov Institute of Oceanology RAS in the Russian EEZ area of the southeastern part of the Baltic Sea in the period from 2004 to 2018. Acoustic data were acquired by echo sounders Simrad EA-400SP and Furuno FS-700. The raw sounding data were filtered and corrected by sound velocity values. The dataset is presented as spreadsheets (*.xslx) and GIS point-class shapes (*.shp). The digital elevation model (DEM) of 1: 500 000 scale has been constructed for the entire Russian EEZ on base of the original array of sounding profiles and an open sources bathymetry.
-
Water body silicate - Seasonal Climatology for Danube Delta (NW Black Sea) for the period 1970-2018 on the domain: Lon E28.5-30.5°E, Lat N43.7-45.6°N. (winter: December-February, - spring: March-May, - summer: June-August, - autumn: September-November). Data Sources: observational data from SeaDataNet/EMODNet Chemistry Data Network. Description of DIVA analysis: The computation was done with the DIVAnd (Data-Interpolating Variational Analysis in n dimensions), version 2.7.5, using GEBCO 30sec topography for the spatial connectivity of water masses. Horizontal correlation length of 47.730km and vertical correlation length of 45m were applied. Depth range: 0, 2.0, 4.0, 6.0, 8.0, 10.0, 15.0, 20.0, 25.0, 30.0, 40.0, 50.0 m. Units: umol/l. The horizontal resolution of the produced DIVAnd maps grids is 0.01 degrees.
-
Moving 6-year analysis of Water_body_dissolved_inorganic_nitrogen_(DIN) in the Black Sea.for each season: spring (March-May), summer (June-August), autumn (September-November), winter (December-February). Every year of the time dimension corresponds to the 6-years centred average of each season. 6-years periods span: - from 1990-1995 until 2013-2018 (spring), - from 1990-1995 until 2013-2018 (summer), - from 1990-1995 until 2013-2018 (autumn), - from 1990-1995 until 2011-2016 (winter). Depth range (IODE standard depths): -100.0, -75.0, -50.0,-40.0, -30.0, -20.0, -10.0, -5.0, -0.0. Data Sources: observational data from SeaDataNet/EMODnet Chemistry Data Network. Description of DIVA analysis: Geostatistical data analysis by DIVA (Data-Interpolating Variational Analysis) tool. GEBCO 1min topography is used for the contouring preparation. Analysed field masked using relative error threshold 0.3 and 0.5 DIVA settings: signal-to-noise ratio and correlation length were estimated using data mean distance as a minimum (for L) and vertically filtered. Background field: the data mean value is subtracted from the data. Detrending of data: no, Advection constraint applied: no. Units: umol/l. The entire set of related maps can be found in the viewing service: http://ec.oceanbrowser.net/emodnet/ .
-
Water body dissolved oxygen concentration - Seasonal Climatology for Danube Delta (NW Black Sea) for the period 1970-2018 on the domain: Lon E28.5-30.5°E, Lat N43.7-45.6°N. (winter: December-February, - spring: March-May, - summer: June-August, - autumn: September-November). Data Sources: observational data from SeaDataNet/EMODNet Chemistry Data Network. Description of DIVA analysis: The computation was done with the DIVAnd (Data-Interpolating Variational Analysis in n dimensions), version 2.7.5, using GEBCO 30sec topography for the spatial connectivity of water masses. Horizontal correlation length of 47.730km and vertical correlation length of 45m were applied. Depth range: 0, 2.0, 4.0, 6.0, 8.0, 10.0, 15.0, 20.0, 25.0, 30.0, 40.0, 50.0. Units: umol/l. The horizontal resolution of the produced DIVAnd maps grids is 0.01 degrees.
-
Water body phosphate - Seasonal Climatology for Danube Delta (NW Black Sea) for the period 1970-2018 on the domain: Lon E28.5-30.5°E, Lat N43.7-45.6°N. (winter: December-February, - spring: March-May, - summer: June-August, - autumn: September-November). Data Sources: observational data from SeaDataNet/EMODNet Chemistry Data Network. Description of DIVA analysis: The computation was done with the DIVAnd (Data-Interpolating Variational Analysis in n dimensions), version 2.7.5, using GEBCO 30sec topography for the spatial connectivity of water masses. Horizontal correlation length of 47.730km and vertical correlation length of 45m were applied. Depth range: 0, 2.0, 4.0, 6.0, 8.0, 10.0, 15.0, 20.0, 25.0, 30.0, 40.0, 50.0 m. Units: umol/l. The horizontal resolution of the produced DIVAnd maps grids is 0.01 degrees.
-
EMODnet Chemistry aims to provide access to marine chemistry data sets and derived data products concerning eutrophication, ocean acidification and contaminants. The chemicals chosen reflect importance to the Marine Strategy Framework Directive (MSFD). This regional aggregated dataset contains all unrestricted EMODnet Chemistry data on contaminants; temperature, salinity and additional sampling parameters are included when available. The spatial coverage is the Black Sea with 20693 CDI records divided per matrices: 18834 water profiles, 1852 sediment profiles and 7 biota profiles. Vertical profiles temporal range is from 1974-08-24 to 2019-12-08 for water, from 1990-07-30 to 2017-10-02 for sediment and from 2008-05-15 to 2008-08-15. Data were harmonised and quality controlled by ‘National Institute for Marine Research and Development "Grigore Antipa"’ from Romania. Regional datasets concerning contaminants are automatically harvested. Parameter names in these datasets are based on P01, BODC Parameter Usage Vocabulary, which is available at: http://seadatanet.maris2.nl/bandit/browse_step.php . Each measurement value has a quality flag indicator. The resulting data collections for each Sea Basin are harmonised, and the collections are quality controlled by EMODnet Chemistry Regional Leaders using ODV Software and following a common methodology for all Sea Regions. Harmonisation means that: (1) unit conversion is carried out to express contaminant concentrations with a limited set of measurement units (according to EU directives 2013/39/UE; Comm. Dec. EU 2017/848) and (2) merging of variables described by different “local names”, but corresponding exactly to the same concepts in BODC P01 vocabulary. Detailed documentation is available at: https://doi.org/10.6092/8b52e8d7-dc92-4305-9337-7634a5cae3f4 Explore and extract data at: https://emodnet-chemistry.webodv.awi.de/contaminants%3EBlackSea The harmonised dataset can also be downloaded as ODV spreadsheet (TXT file), which is composed of metadata header followed by tab separated values. This worksheet can be imported to ODV Software for visualisation (More information can be found at: https://www.seadatanet.org/Software/ODV ). The same dataset is offered also as TXT file in a long/vertical format, in which each P01 measurement is a record line. Additionally, there are a series of columns that split P01 terms in subcomponents (measure, substance, CAS number, matrix...).This transposed format is more adapted to worksheet applications users (e.g. LibreOffice Calc). The original datasets can be searched and downloaded from EMODnet Chemistry Download Service: https://emodnet-chemistry.maris.nl/search
-
EMODnet Chemistry aims to provide access to marine chemistry data sets and derived data products concerning eutrophication, ocean acidification and contaminants. The chemicals chosen reflect importance to the Marine Strategy Framework Directive (MSFD). This regional aggregated dataset contains all unrestricted EMODnet Chemistry data on contaminants (48 parameters), and covers the Black Sea with 21504 CDI records divided per matrices: 7 biota profiles, 19677 water profiles, 1820 sediment profiles. Vertical profiles temporal range is from 1974-08-24 to 2017-10-06. Data were aggregated and quality controlled by ‘National Institute for Marine Research and Development "Grigore Antipa"’ from Romania. Regional datasets concerning contaminants are automatically harvested. Parameter names in these datasets are based on P01, BODC Parameter Usage Vocabulary, which is available at: http://seadatanet.maris2.nl/bandit/browse_step.php . Each measurement value has a quality flag indicator. The resulting data collections for each Sea Basin are harmonised, and the collections are quality controlled by EMODnet Chemistry Regional Leaders using ODV Software and following a common methodology for all Sea Regions. Harmonisation means that: (1) unit conversion is carried out to express contaminant concentrations with a limited set of measurement units (according to EU directives 2013/39/UE; Comm. Dec. EU 2017/848) and (2) merging of variables described by different “local names”, but corresponding exactly to the same concepts in BODC P01 vocabulary. The harmonised dataset can be downloaded as ODV spreadsheet (TXT file), which is composed of metadata header followed by tab separated values. This worksheet can be imported to ODV Software for visualisation (More information can be found at: https://www.seadatanet.org/Software/ODV ). The same dataset is offered also as XLSX file in a long/vertical format, in which each P01 measurement is a record line. Additionally, there are a series of columns that split P01 terms in subcomponents (measure, substance, CAS number, matrix...).This transposed format is more adapted to worksheet applications users (e.g. LibreOffice Calc). The 48 parameter names in this metadata record are based on P02, SeaDataNet Parameter Discovery Vocabulary, which is available at: http://seadatanet.maris2.nl/v_bodc_vocab_v2/vocab_relations.asp?lib=P02 . Detailed documentation will be published soon. The original datasets can be searched and downloaded from EMODnet Chemistry Download Service: https://emodnet-chemistry.maris.nl/search
-
EMODnet Chemistry aims to provide access to marine chemistry data sets and derived data products concerning eutrophication, ocean acidification and contaminants. The chemicals chosen reflect importance to the Marine Strategy Framework Directive (MSFD). This regional aggregated dataset contains all unrestricted EMODnet Chemistry data on contaminants (20 parameters), and covers the North East Atlantic Ocean with 2400 CDI records divided per matrices: 122 in biota (as time series), 1689 in water (as vertical profiles), 589 in sediment (478 Vertical profiles and 111 Time series). Vertical profiles temporal range is from 1970-07-29 to 2017-02-28. Time series temporal range is from 1979-02-28 to 2014-10-21. Data were aggregated and quality controlled by ‘IFREMER / IDM / SISMER - Scientific Information Systems for the SEA’ from France. Regional datasets concerning contaminants are automatically harvested. Parameter names in these datasets are based on P01, BODC Parameter Usage Vocabulary, which is available at: http://seadatanet.maris2.nl/bandit/browse_step.php . Each measurement value has a quality flag indicator. The resulting data collections for each Sea Basin are harmonised, and the collections are quality controlled by EMODnet Chemistry Regional Leaders using ODV Software and following a common methodology for all Sea Regions. Harmonisation means that: (1) unit conversion is carried out to express contaminant concentrations with a limited set of measurement units (according to EU directives 2013/39/UE; Comm. Dec. EU 2017/848) and (2) merging of variables described by different “local names” ,but corresponding exactly to the same concepts in BODC P01 vocabulary. The harmonised dataset can be downloaded as ODV spreadsheet (TXT file), which is composed of metadata header followed by tab separated values. This worksheet can be imported to ODV Software for visualisation (More information can be found at: https://www.seadatanet.org/Software/ODV ). The same dataset is offered also as XLSX file in a long/vertical format, in which each P01 measurement is a record line. Additionally, there are a series of columns that split P01 terms in subcomponents (measure, substance, CAS number, matrix...).This transposed format is more adapted to worksheet applications users (e.g. LibreOffice Calc). The 20 parameter names in this metadata record are based on P02, SeaDataNet Parameter Discovery Vocabulary, which is available at: http://seadatanet.maris2.nl/v_bodc_vocab_v2/vocab_relations.asp?lib=P02 . Detailed documentation will be published soon. The original datasets can be searched and downloaded from EMODnet Chemistry Download Service: https://emodnet-chemistry.maris.nl/search
-
Moving 6-year analysis of Water_body_silicate in the Black Sea for each season: spring (March-May), summer (June-August), autumn (September-November), winter (December-February). Every year of the time dimension corresponds to the 6-years centred average of each season. 6-years periods span: from 1970-1975 until 2013-2018 Depth range (IODE standard depths): -200.0, -150.0, -125.0, -100.0, -75.0, -50.0,-40.0, -30.0, -20.0, -10.0, -5.0, -0.0. Data Sources: observational data from SeaDataNet/EMODnet Chemistry Data Network. Description of DIVA analysis: Geostatistical data analysis by DIVA (Data-Interpolating Variational Analysis) tool. GEBCO 1min topography is used for the contouring preparation. Analysed field masked using relative error threshold 0.3 and 0.5 DIVA settings: signal-to-noise ratio and correlation length were estimated using data mean distance as a minimum (for L) and vertically filtered. Log transformation was used in the analyses. Background field: the data mean value is subtracted from the data. Detrending of data: no, Advection constraint applied: no. Units: umol/l. The entire set of related maps can be found in the viewing service: http://ec.oceanbrowser.net/emodnet/
-
Moving 6-year analysis of Water_body_phosphate in the Black Sea for each season: spring (March-May), summer (June-August), autumn (September-November), winter (December-February). Every year of the time dimension corresponds to the 6-years centred average of each season. 6-years periods span: from 1970-1975 until 2013-2018 Depth range (IODE standard depths): -200.0, -150.0, -125.0, -100.0, -75.0, -50.0,-40.0, -30.0, -20.0, -10.0, -5.0, -0.0. Data Sources: observational data from SeaDataNet/EMODnet Chemistry Data Network. Description of DIVA analysis: Geostatistical data analysis by DIVA (Data-Interpolating Variational Analysis) tool. GEBCO 1min topography is used for the contouring preparation. Analysed field masked using relative error threshold 0.3 and 0.5 DIVA settings: signal-to-noise ratio and correlation length were estimated using data mean distance as a minimum (for L) and vertically filtered. Log transformation was used in the analyses. Background field: the data mean value is subtracted from the data. Detrending of data: no, Advection constraint applied: no. Units: umol/l. The entire set of related maps can be found in the viewing service: http://ec.oceanbrowser.net/emodnet/