 Metadata catalogue
OGS (Istituto Nazionale di Oceanografia e di Geofisica Sperimentale), Division of Oceanography
Type of resources
Available actions
Topics
INSPIRE themes
Keywords
Contact for the resource
Provided by
Years
Formats
Representation types
Resolution
-
The SDC_BLS_CLIM_TS_V2 product contains Temperature and Salinity Climatologies for Black Sea including the seasonal and monthly fields for period 1955-2019 and seasonal fields for 6 decades starting from 1955 to 2019. The climatic fields were computed from the integrated Black Sea dataset that combines data extracted from the 3 major sources: 1) SeaDataNet infrastructure, 2) World Ocean Database, and 3) Coriolis Ocean Dataset for Reanalysis. The computation was done with the DIVAnd (Data-Interpolating Variational Analysis in n dimensions), version 2.6.4.
-

Moving 10-years analysis of chlorophyll-a at Mediterranean Sea for each season : - winter (January-March), - spring (April-June), - summer (July-September), - autumn (October-December). Every year of the time dimension corresponds to the 10-year centered average of each season. Decades span from 1972-1981 until 2006-2015. Observational data span from 1911 to 2015. Depth range (IODE standard depths): -2500.0, -2000.0, -1750.0, -1500.0, -1400.0, -1300.0, -1200.0, -1100.0, -1000.0, -900.0, -800.0, -700.0, -600.0, -500.0, -400.0, -300.0, -250.0, -200.0, -150.0, -125.0, -100.0, -75.0, -50.0, -30.0, -20.0, -10.0, -5.0, -0.0. Data Sources: observational data from SeaDataNet/EMODNet Chemistry Data Network. Description of DIVA analysis: Geostatistical data analysis by DIVA (Data-Interpolating Variational Analysis) tool. Profiles were interpolated at standard depths using weighted parabolic interpolation algorithm (Reiniger and Ross, 1968). GEBCO 1min topography is used for the contouring preparation. Analyzed filed masked using relative error threshold 0.3 and 0.5. DIVA settings: A constant value for signal-to-noise ratio was used equal to 1. Correlation length was optimized and filtered vertically and a seasonally-averaged profile was used. Logarithmic transformation applied to the data prior to the analysis. Background field: the data mean value is subtracted from the data. Detrending of data: no. Advection constraint applied: no. Originators of Italian data sets-List of contributors: o Brunetti Fabio (OGS) o Cardin Vanessa, Bensi Manuel doi:10.6092/36728450-4296-4e6a-967d-d5b6da55f306 o Cardin Vanessa, Bensi Manuel, Ursella Laura, Siena Giuseppe doi:10.6092/f8e6d18e-f877-4aa5-a983-a03b06ccb987 o Cataletto Bruno (OGS) o Cinzia Comici Cinzia (OGS) o Civitarese Giuseppe (OGS) o DeVittor Cinzia (OGS) o Giani Michele (OGS) o Kovacevic Vedrana (OGS) o Mosetti Renzo (OGS) o Solidoro C.,Beran A.,Cataletto B.,Celussi M.,Cibic T.,Comici C.,Del Negro P.,De Vittor C.,Minocci M.,Monti M.,Fabbro C.,Falconi C.,Franzo A.,Libralato S.,Lipizer M.,Negussanti J.S.,Russel H.,Valli G., doi:10.6092/e5518899-b914-43b0-8139-023718aa63f5 o Celio Massimo (ARPA FVG) o Malaguti Antonella (ENEA) o Fonda Umani Serena (UNITS) o Bignami Francesco (ISAC/CNR) o Boldrini Alfredo (ISMAR/CNR) o Marini Mauro (ISMAR/CNR) o Miserocchi Stefano (ISMAR/CNR) o Zaccone Renata (IAMC/CNR) o Lavezza, R., Dubroca, L. F. C., Ludicone, D., Kress, N., Herut, B., Civitarese, G., Cruzado, A., Lefèvre, D., Souvermezoglou, E., Yilmaz, A., Tugrul, S., and Ribera d'Alcala, M.: Compilation of quality controlled nutrient profiles from the Mediterranean Sea, doi:10.1594/PANGAEA.771907, 2011. Units: mg/m^3
-

The "EMODnet Digital Bathymetry (DTM)- 2018" is a multilayer bathymetric product for Europe’s sea basins covering: • the Greater North Sea, including the Kattegat and stretches of water such as Fair Isle, Cromarty, Forth, Forties,Dover, Wight, and Portland • the English Channel and Celtic Seas • Western Mediterranean, the Ionian Sea and the Central Mediterranean Sea • Iberian Coast and Bay of Biscay (Atlantic Ocean) • Adriatic Sea (Mediterranean) • Aegean - Levantine Sea (Mediterranean). • Madeira and Azores (Macaronesia) • Baltic Sea • Black Sea • Norwegian and Icelandic Seas • Canary Islands (Macaronesia) • Arctic region and Barentz Sea The DTM is based upon more than 9400 bathymetric survey data sets and Composite DTMs that have been gathered from 49 data providers from 24 countries riparian to European seas. Also Satellite Derived Bathymetry data products have been included derived from Landsat 8 satellite images. The source reference layer in the portal viewing service gives metadata of the data sets used with their data providers; the metadata also acknowledges the data originators. The incorporated survey data sets itself can be discovered and requested for access through the Common Data Index (CDI) data discovery and access service that in September 2018 contained > 27.000 survey data sets from European data providers for global waters. The Composite DTMs can be discovered through the Sextant Catalogue service. Both discovery services make use of SeaDataNet standards and services and have been integrated in the EMODnet Bathymetry web portal (http://www.emodnet-bathymetry.eu). In addition, the Bathymetry Viewing and Download service of the EMODnet bathymetry portal gives users wide functionality for viewing and downloading the EMODnet digital bathymetry such as: • water depth (refering to the Lowest Astronomical Tide Datum - LAT) in gridded form on a DTM grid of 1/16 * 1/16 arc minute of longitude and latitude (ca 115 * 115 meters) • option to view depth parameters of individual DTM cells and references to source data • option to download DTM in 64 tiles in different formats: EMO, EMO (without GEBCO data), ESRI ASCII, ESRI ASCII Mean Sea Level, XYZ, NetCDF (CF), RGB GeoTiff and SD • option to visualize the DTM in 3D in the browser without plug-in • layer with a number of high resolution DTMs for coastal regions • layer with wrecks from the UKHO Wrecks database. The EMODnet DTM is also available by means of OGC web services (WMS, WFS, WCS, WMTS), which are specified at the EMODnet Bathymetry portal. The original datasets themselves are not distributed but described in the metadata services, giving clear information about the background survey data used for the DTM, their access restrictions, originators and distributors and facilitating requests by users to originator.
-
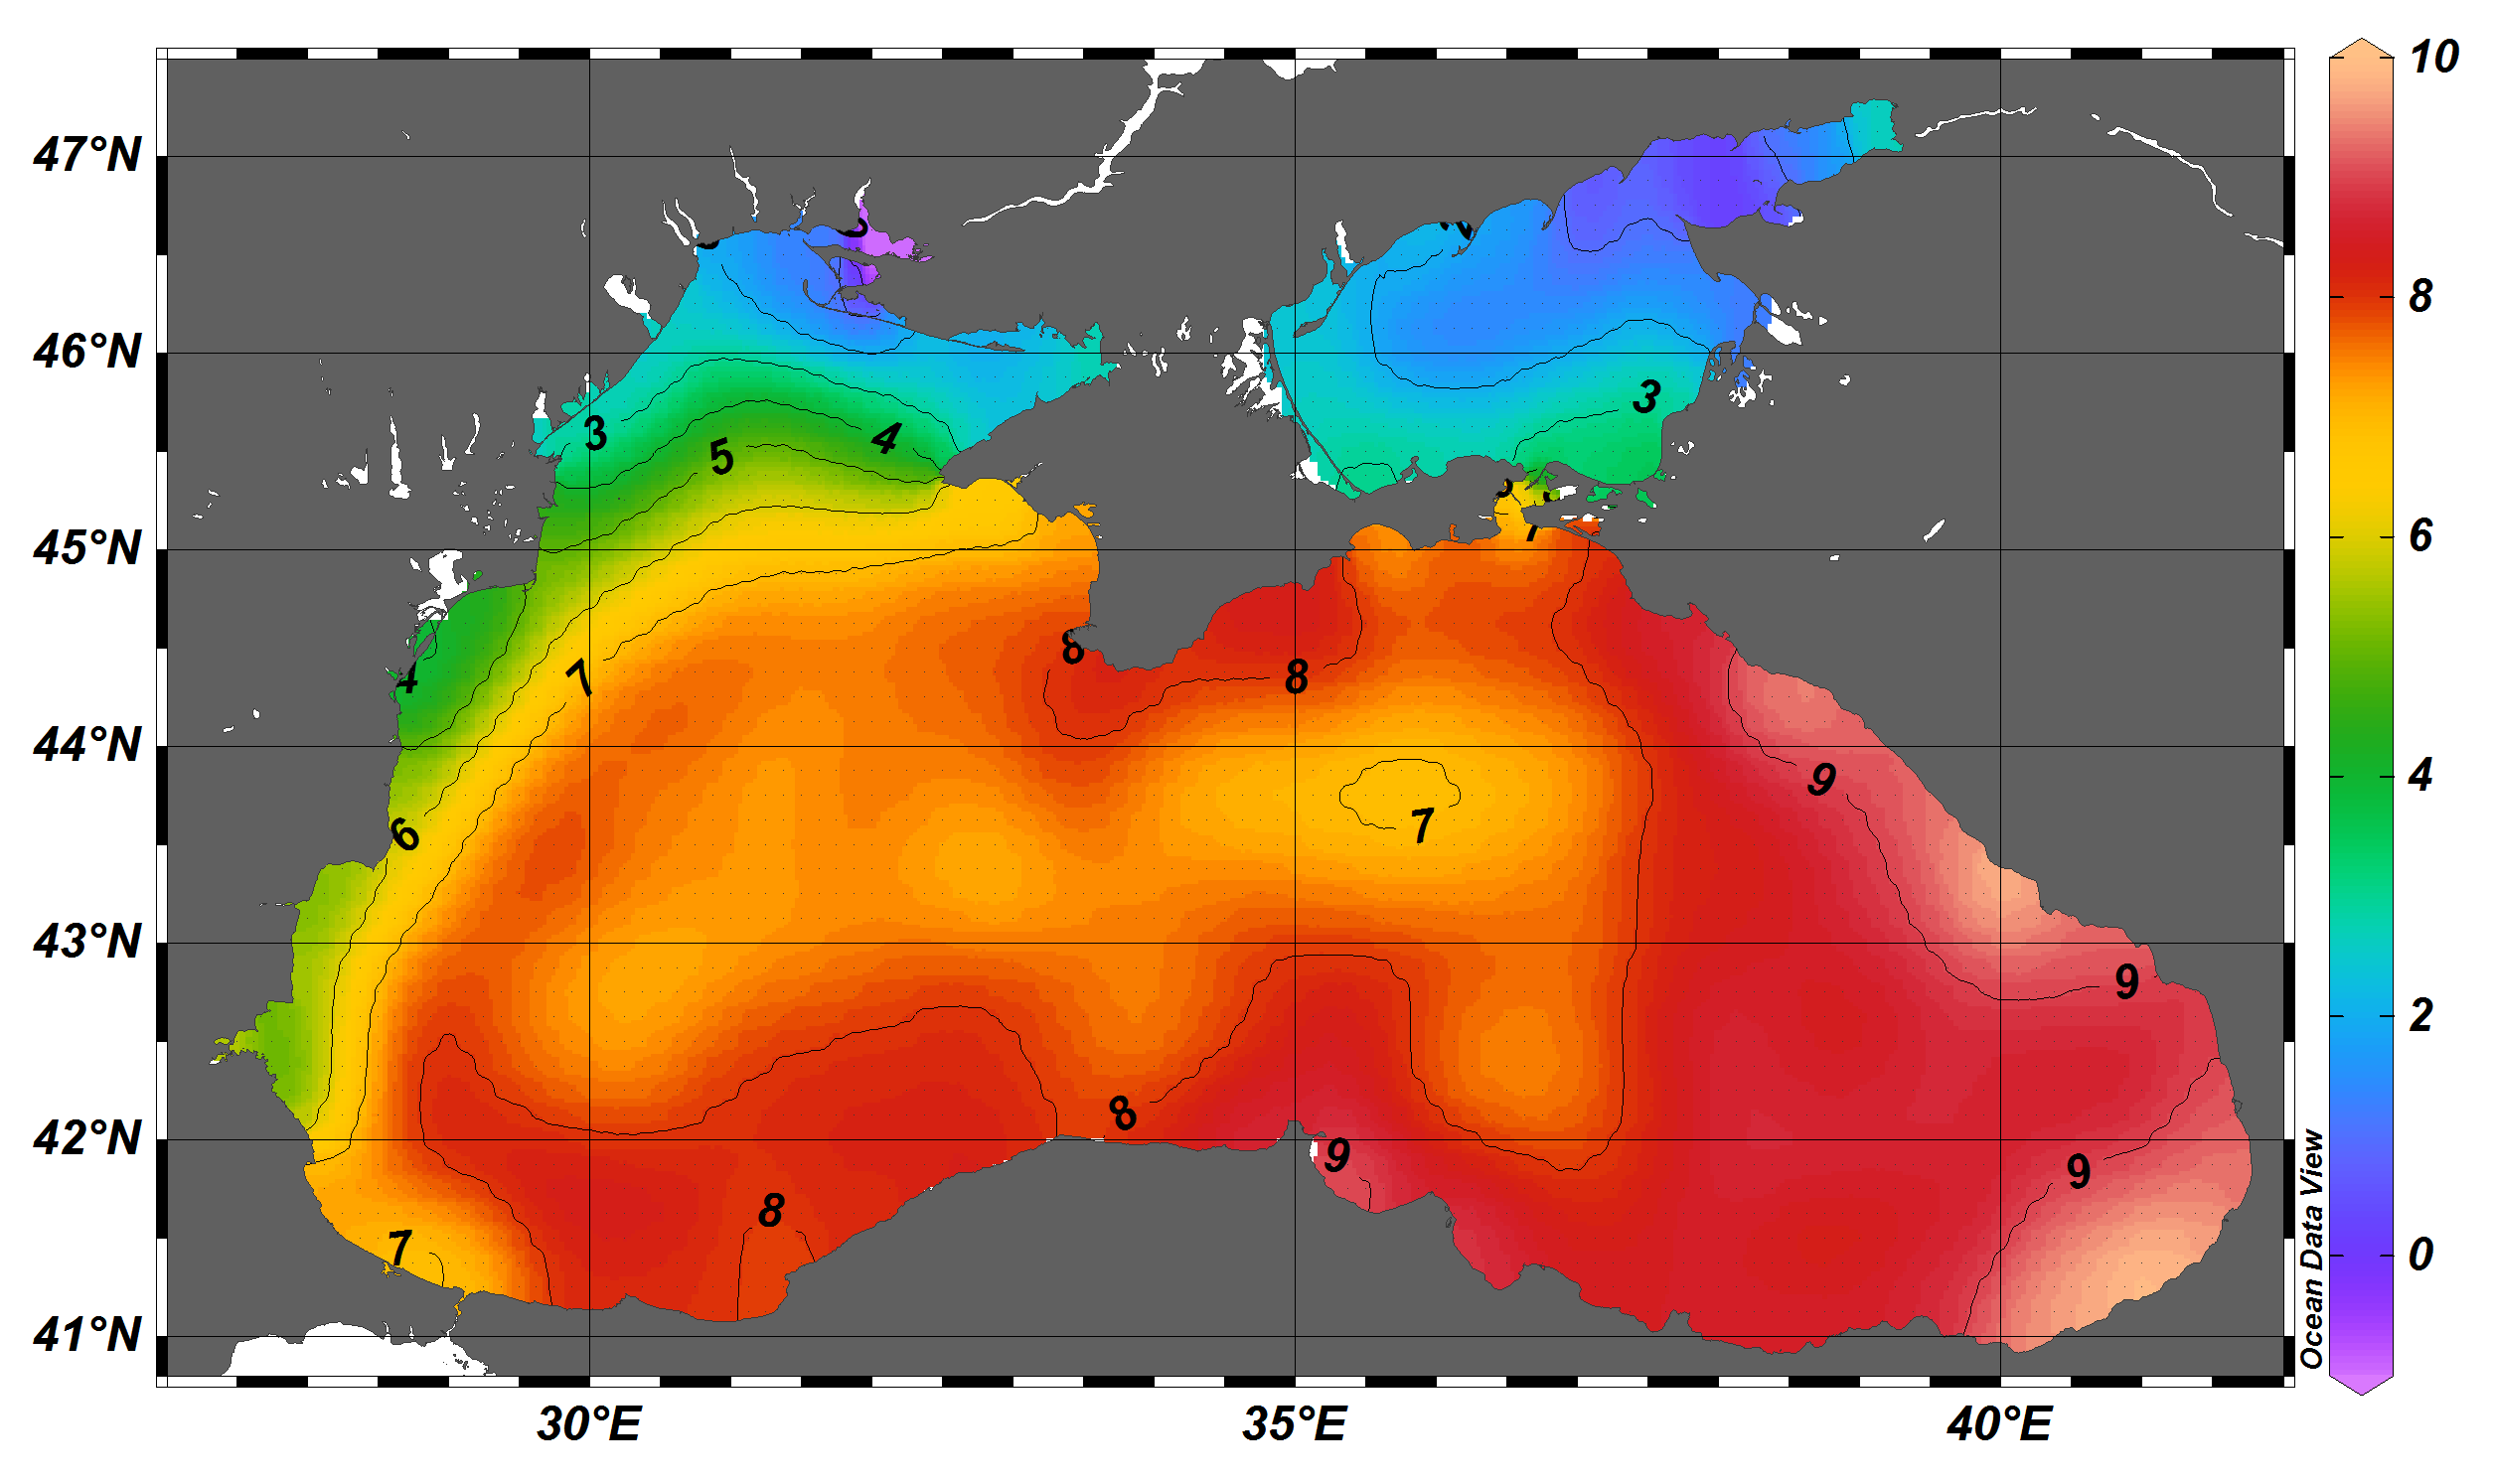
The SDC_BLS_CLIM_TS_V1 product contains Temperature and Salinity Climatologies for Black Sea including the seasonal and monthly fields for period 1955-2017 and seasonal fields for 6 decades starting from 1955 to 2014. The climatic fields were computed from the integrated Black Sea dataset that combines data extracted from the 3 major sources: 1) SeaDataNet infrastructure, 2) World Ocean Database 2018, and 3) Coriolis Ocean Dataset for Reanalysis. The computation was done with the DIVAnd (Data-Interpolating Variational Analysis in n dimensions), version 2.3.1.
-

The SDC_MED_CLIM_TS_V2 product contains Temperature and Salinity Climatologies for Mediterranean Sea: monthly and seasonal fields for time periods 1955-2018, 1955-1984 and 1985-2018 and seasonal fields for 6 decades covering the time period 1955 to 2018. The climatic fields were computed from an integrated Mediterranean Sea data set that combines data extracted from SeaDataNet infrastructure (SDC_MED_DATA_TS_V2, https://doi.org/10.12770/2a2aa0c5-4054-4a62-a18b-3835b304fe64) and Coriolis Ocean Dataset for Reanalysis (CORA5.2) distributed by the Copernicus Marine Service (INSITU_GLO_TS_REP_OBSERVATIONS_013_001_b). The computation was done with the DIVAnd (Data-Interpolating Variational Analysis), version 2.4.0.
-
The SDC_MED_CLIM_TS_V1 product contains Temperature and Salinity Climatologies for Mediterranean Sea: monthly and seasonal fields for periods 1955-2017, 1955-1984 and 1985-2017 and seasonal fields for 6 decades covering the time period 1955 to 2017. The climatic fields were computed from an integrated Mediterranean Sea data set that combines data extracted from SeaDataNet infrastructure (https://doi.org/10.12770/2698a37e-c78b-4f78-be0b-ec536c4cb4b3) and Coriolis Ocean Dataset for Reanalysis (CORA5.2) distributed by the Copernicus Marine Service (http://marine.copernicus.eu/services-portfolio/access-to-products/?option=com_csw&view=details&product_id=INSITU_GLO_TS_REP_OBSERVATIONS_013_001_b). The computation was done with the DIVAnd (Data-Interpolating Variational Analysis in n dimensions), version 2.4.0.
-
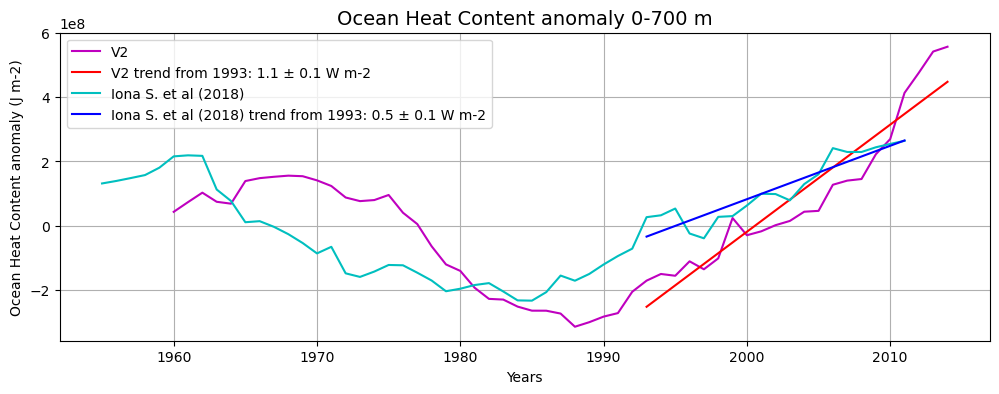
The SDC_MED_DP2 product contains 55 sliding decadal temperature fields (1955-1964, 1956-1965, 1957-1966, …, 2009-2018) at 1/8° horizontal resolution obtained in the 0-2000m layer and two derived OHC annual anomaly estimates for the 0-700m and the 0-2000m layers. Sliding decades of annual Temperature fields were obtained from an integrated Mediterranean Sea dataset covering the time period 1955-2018, which combines data extracted from SeaDataNet infrastructure at the end of July 2019 (SDC_MED_DATA_TS_V2, https://doi.org/10.12770/3f8eaace-9f9b-4b1b-a7a4-9c55270e205a) and the Coriolis Ocean Dataset for Reanalysis (CORA 5.2, accessed in July 2020, https://archimer.ifremer.fr/doc/00595/70726/). The resulting annual OHC anomaly time series span the 1960-2014 period. The analysis was performed with the DIVAnd (Data-Interpolating Variational Analysis in n dimensions), version 2.6.1.
-
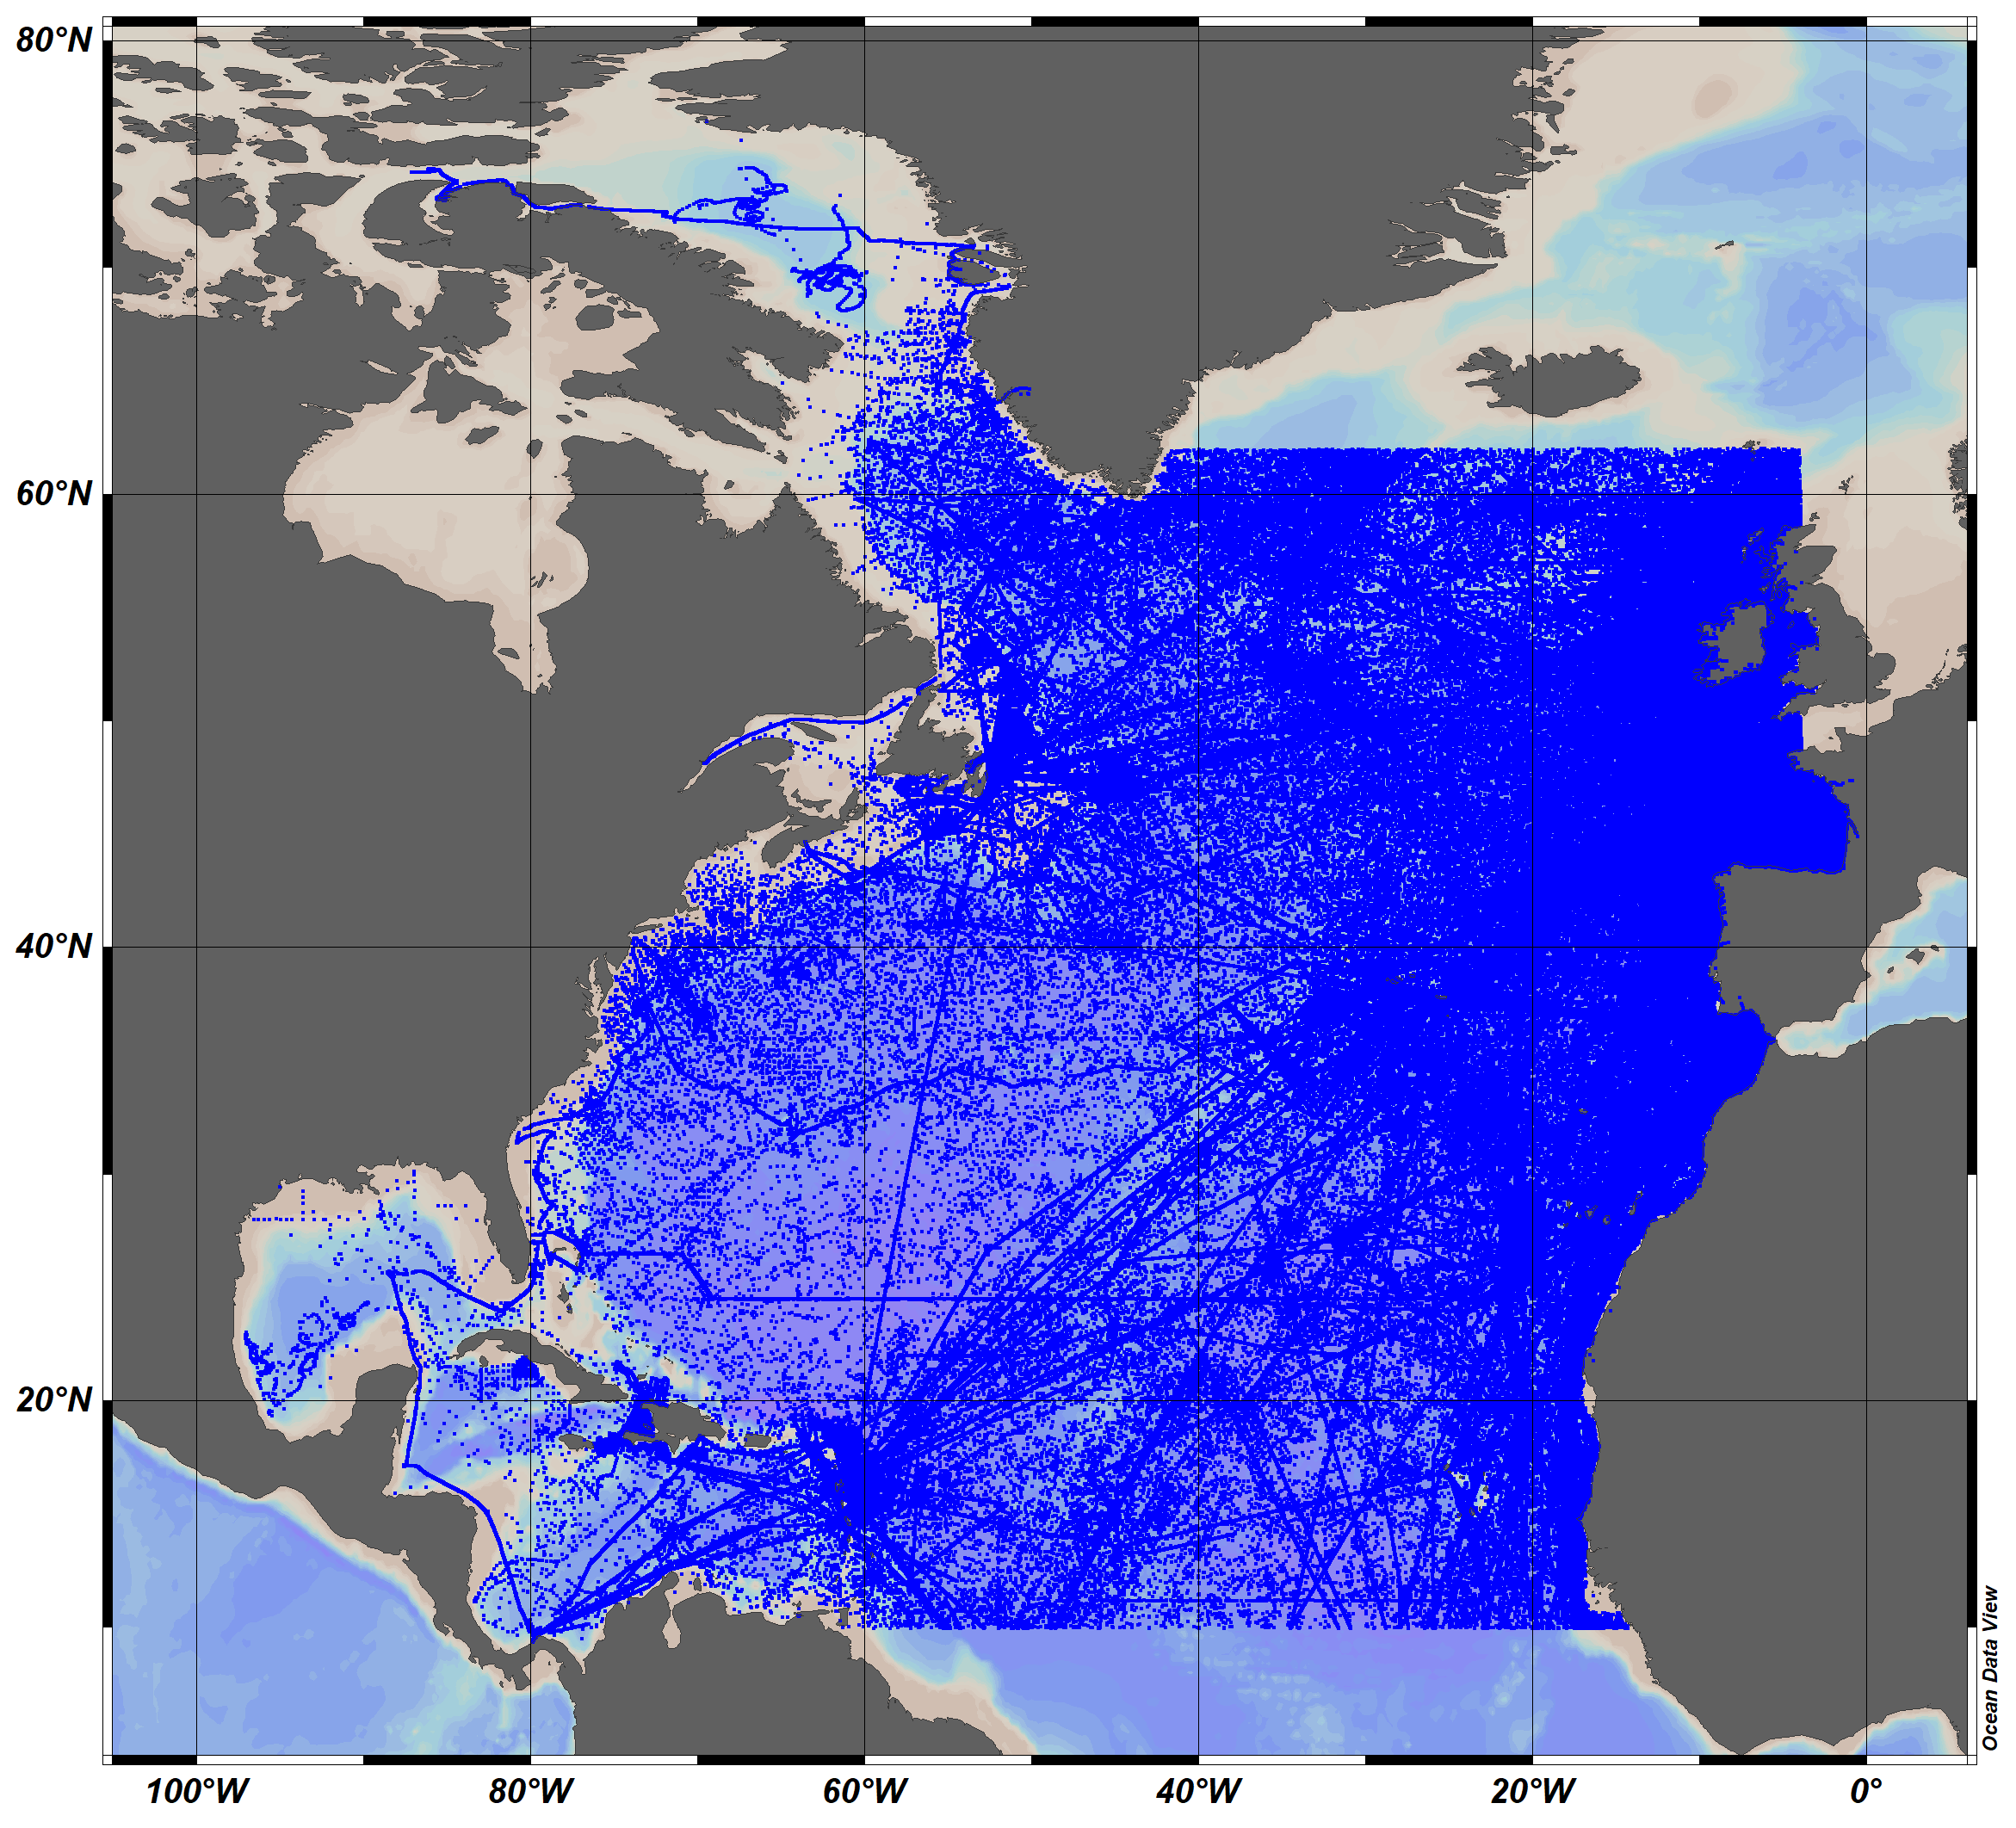
The SeaDataCloud TS historical data collection V2 for the North Atlantic Ocean, includes open access in situ data on temperature and salinity of water column in the North Atlantic Ocean from 10°N to 62°N, including the Labrador Sea, The data were retrieved from the SeaDataNet infrastructure at summer 2019. The dataset format is Ocean Data View (ODV - http://odv.awi.de/) binary collection. The quality control of the data has been performed with the help of ODV software. Data Quality Flags have been revised and set up using the elaborated by SeaDataNet2 project QC procedures in conjunction with the visual expert check. The final number of the Temperature and Salinity profiles (stations) in the collection is 10119755. For data access please register at http://www.marine-id.org/.
-
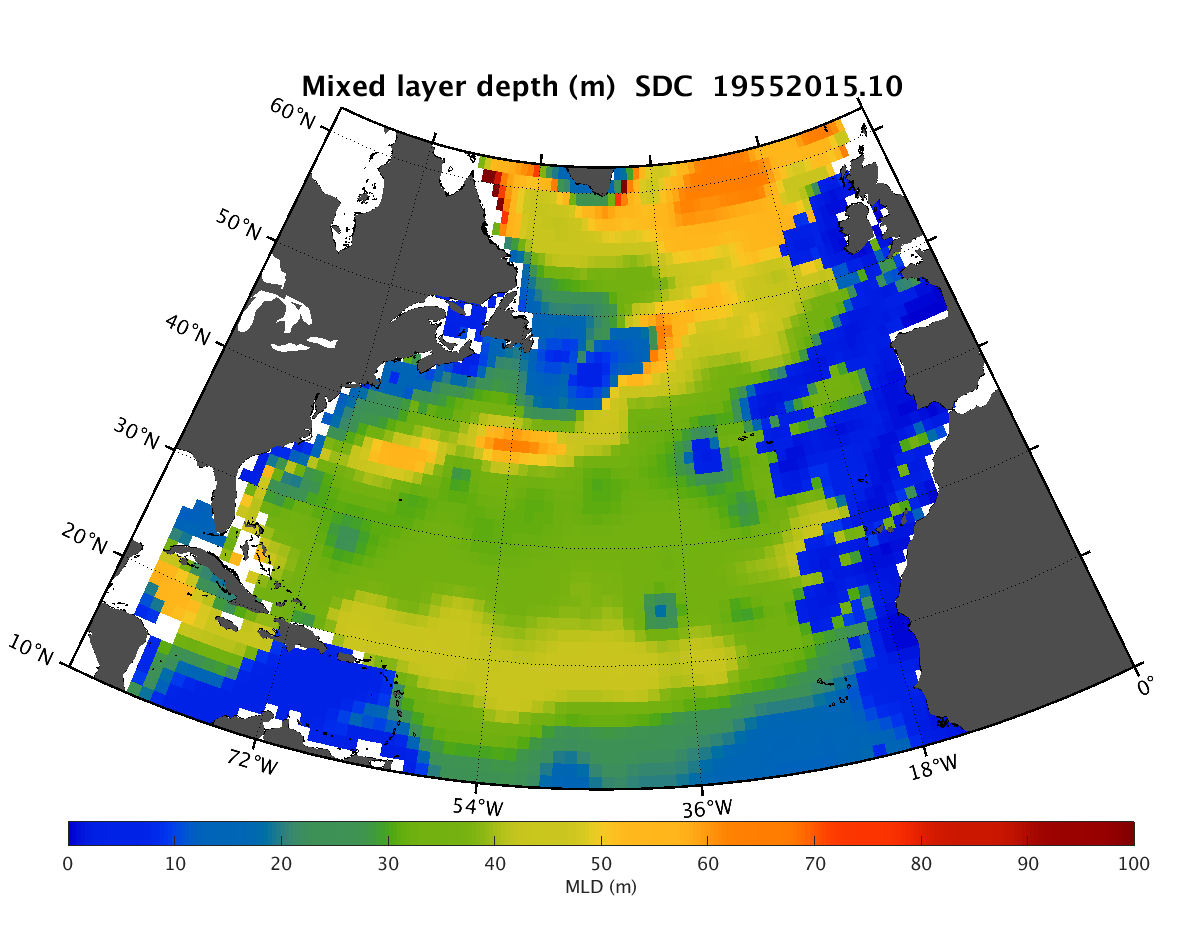
The SDC_NAT_DP1 product contains the North Atlantic Ocean monthly climatology for mixed layer depth (MLD) based on temperature climatology spanning 60 years (1955-2015). The MLD fields have spatial resolution 1/4°. The profiles of temperature combines data from 2 major sources, the SeaDataNet infrastructure and a part of data of the Coriolis Ocean Dataset for Reanalysis (CORA). The used climatology is the SeaDataCloud North Atlantic Ocean Temperature Climatology V1 (https://doi.org/10.13155/61810) done with the DIVA software, version 4.7.2. The product was developed in framework of the SeaDataCloud project. This product must be considered as feasibility study for the next phases, it is a beta-version and that further research needs to be done before its usage from users.
-
The SDC_NAT_CLIM_TS_V2 product contains Temperature and Salinity Climatologies for the North Atlantic Ocean including the seasonal and monthly fields for 7 decades starting from 1950 to 2019. One resolution has been processed : 1/2°. The climatic fields were computed from the integrated North Atlantic Ocean dataset that combines data extracted from the 2 major sources: SeaDataNet infrastructure and Coriolis Ocean Dataset for Reanalysis (CORA). The computation was done with the DIVAnd software.