 Metadata catalogue
Institute of Marine Research
Type of resources
Available actions
Topics
INSPIRE themes
Keywords
Contact for the resource
Provided by
Years
Formats
Representation types
Scale
Resolution
-
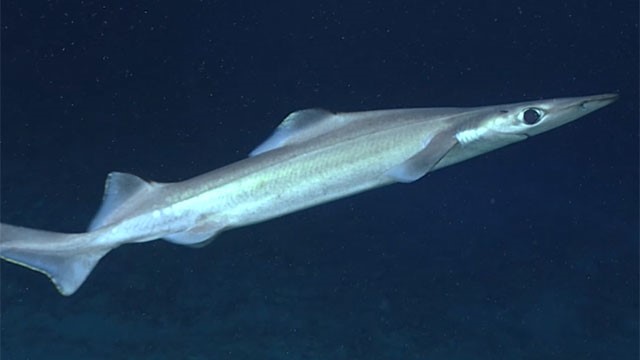
We developed predictive distribution models of deep-sea elasmobranchs for up to 2000 m depth in the Azores EEZ and neighboring seamounts, from approximately 33°N to 43°N and 20°W to 36°W. Georeferenced presence, absence, and abundance data were obtained from scientific surveys and commercial operations reporting at least one deep-sea elasmobranch capture. A 20-year 'survey dataset' (1996-2017) was compiled from annual scientific demersal surveys using two types of bottom longlines (types LLA and LLB), and an 'observer dataset' (2004-2018) from observer programs covering commercial fisheries operations using bottom longline (similar to type LLA) and vertical handline ('gorazeira').
-

The bathymetry data were collected from the online data source Norge Digitalt (http://www.norgedigitalt.no) established by the Norwegian Mapping Authority, the Hydrographic service (Statens Kartverk Sjø). The original resolution is about 50m on an irregular grid. IMR has interpolated the bathymetry to four 50m x 50m UTM-grids, and simple extrapolation is applied towards a high-resolution coast line, also provided by the Norwegian Mapping Authority.
-
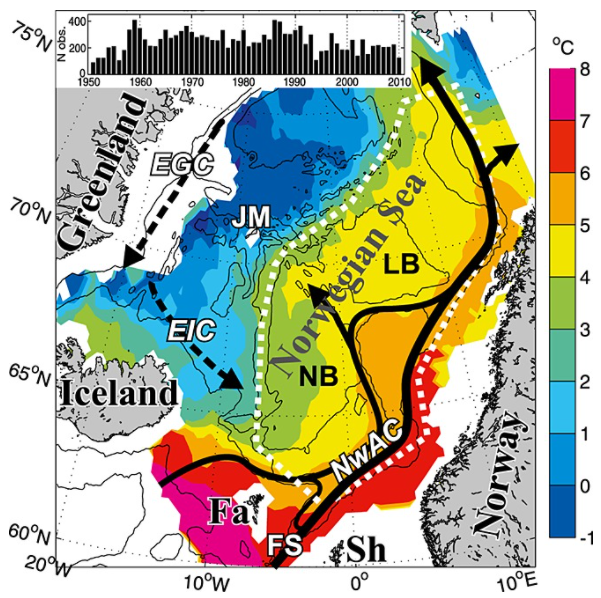
Climate variability in the Norwegian Sea was investigated in terms of ocean heat and freshwater contents of Atlantic water above a reference surface, using hydrographic data during spring 1951–2010. The main processes acting on this variability were examined and then quantified. The area-averaged water mass cooled and freshened, but a deepening of the reference surface resulted in a positive trend in the heat content of 0.3 W m−2. Air-sea heat fluxes explained about half of the interannual variability in heat content. The effect of the advection of Atlantic and Arctic waters on the variability varied with time, apparently due to large-scale changes in the ocean circulation. The data are consistent with the explanation that changing wind patterns caused buffering and then release of Arctic water in the Iceland Sea during the late 1960s to early 1970s, and this caused large hydrographic changes in the Norwegian Sea.
-

We assembled a dataset of 14C-based productivity measurements to understand the critical variables required for accurate assessment of daily depth-integrated phytoplankton carbon fixation (PP(PPeu)u) from measurements of sea surface pigment concentrations (Csat)(Csat). From this dataset, we developed a light-dependent, depth-resolved model for carbon fixation (VGPM) that partitions environmental factors affecting primary production into those that influence the relative vertical distribution of primary production (Pz)z) and those that control the optimal assimilation efficiency of the productivity profile (P(PBopt). The VGPM accounted for 79% of the observed variability in Pz and 86% of the variability in PPeu by using measured values of PBopt. Our results indicate that the accuracy of productivity algorithms in estimating PPeu is dependent primarily upon the ability to accurately represent variability in Pbopt. We developed a temperature-dependent Pbopt model that was used in conjunction with monthly climatological images of Csat sea surface temperature, and cloud-corrected estimates of surface irradiance to calculate a global annual phytoplankton carbon fixation (PPannu) rate of 43.5 Pg C yr‒1. The geographical distribution of PPannu was distinctly different than results from previous models. Our results illustrate the importance of focusing Pbopt model development on temporal and spatial, rather than the vertical, variability.
-
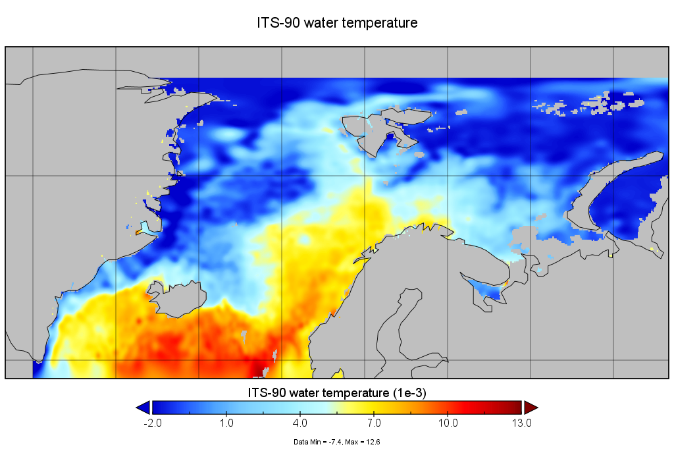
The SeaDataCloud Temperature and Salinity Climatologies have been processed from the historical Data Collection of the Arctic Ocean (from 56°N to 83°N and from 45°W to 70°E) including temperature and salinity in situ data of the water column for the period 1955 – 2019. The analysis was run in six decadal periods (1955-1964/1965-1974/1975-1984/1985-1994/1995-2004/2005-2014). A subset of the World Ocean Database 2018 (WOD18, https://www.nodc.noaa.gov/OC5/WOD/pr_wod.html) dataset has been integrated as external data-source to improve data availability for analysis.
-

SeaDataNet Temperature and Salinity historical data collection for the North Arctic Ocean, including revised quality flags after quality control with ODV. For data access please register at http://www.marine-id.org The dataset format is ODV binary collections. You can read, analyse and export from the ODV application provided by Alfred Wegener institute at http://odv.awi.de/
-
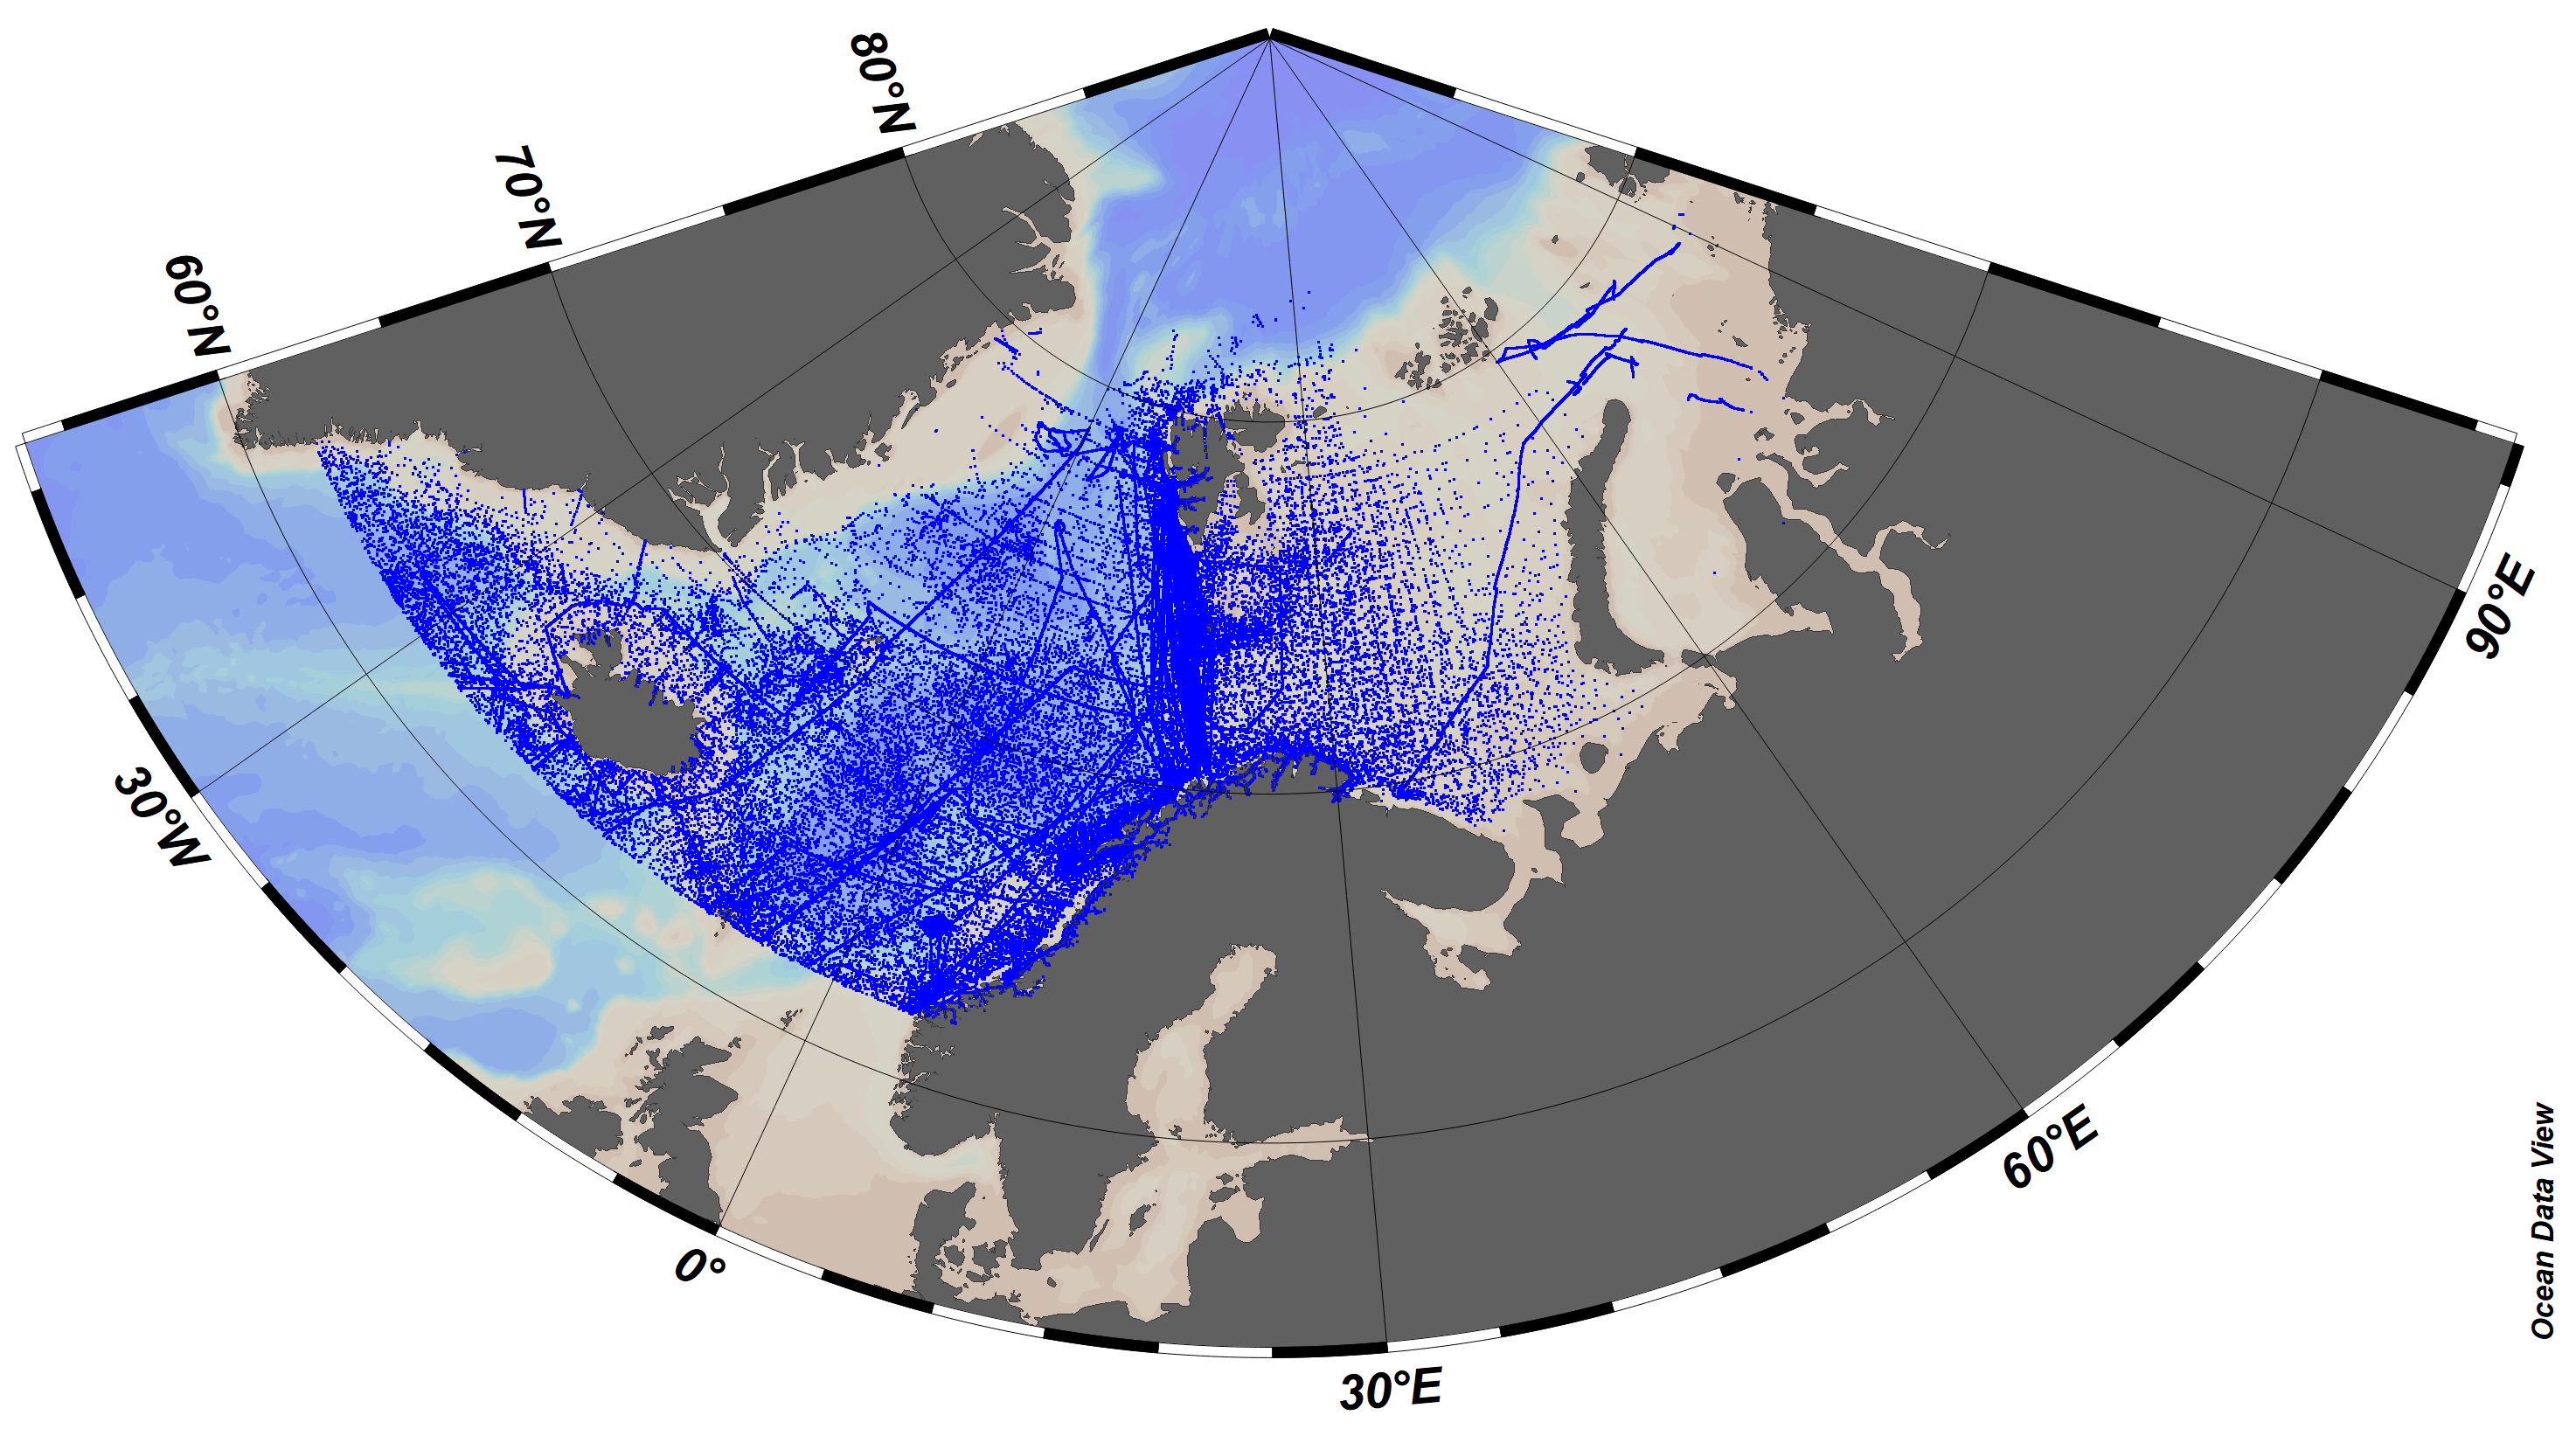
SeaDataCloud Temperature and Salinity historical data collection for the Arctic Ocean, including revised quality flags after quality control with ODV. The dataset format is ODV binary collections. You can read, analyse and export from the ODV application provided by Alfred Wegener institute at http://odv.awi.de/. For data access please register at http://www.marine-id.org/.