 Metadata catalogue
Hellenic Centre for Marine Research (HCMR)
Type of resources
Available actions
Topics
INSPIRE themes
Keywords
Contact for the resource
Provided by
Years
Formats
Representation types
Scale
Resolution
-
EMODnet Chemistry aims to provide access to marine chemistry data sets and derived data products concerning eutrophication, ocean acidification and contaminants. The chemicals chosen reflect importance to the Marine Strategy Framework Directive (MSFD). This regional aggregated dataset contains all unrestricted EMODnet Chemistry data on contaminants (20 parameters), and covers the North East Atlantic Ocean with 2400 CDI records divided per matrices: 122 in biota (as time series), 1689 in water (as vertical profiles), 589 in sediment (478 Vertical profiles and 111 Time series). Vertical profiles temporal range is from 1970-07-29 to 2017-02-28. Time series temporal range is from 1979-02-28 to 2014-10-21. Data were aggregated and quality controlled by ‘IFREMER / IDM / SISMER - Scientific Information Systems for the SEA’ from France. Regional datasets concerning contaminants are automatically harvested. Parameter names in these datasets are based on P01, BODC Parameter Usage Vocabulary, which is available at: http://seadatanet.maris2.nl/bandit/browse_step.php . Each measurement value has a quality flag indicator. The resulting data collections for each Sea Basin are harmonised, and the collections are quality controlled by EMODnet Chemistry Regional Leaders using ODV Software and following a common methodology for all Sea Regions. Harmonisation means that: (1) unit conversion is carried out to express contaminant concentrations with a limited set of measurement units (according to EU directives 2013/39/UE; Comm. Dec. EU 2017/848) and (2) merging of variables described by different “local names” ,but corresponding exactly to the same concepts in BODC P01 vocabulary. The harmonised dataset can be downloaded as ODV spreadsheet (TXT file), which is composed of metadata header followed by tab separated values. This worksheet can be imported to ODV Software for visualisation (More information can be found at: https://www.seadatanet.org/Software/ODV ). The same dataset is offered also as XLSX file in a long/vertical format, in which each P01 measurement is a record line. Additionally, there are a series of columns that split P01 terms in subcomponents (measure, substance, CAS number, matrix...).This transposed format is more adapted to worksheet applications users (e.g. LibreOffice Calc). The 20 parameter names in this metadata record are based on P02, SeaDataNet Parameter Discovery Vocabulary, which is available at: http://seadatanet.maris2.nl/v_bodc_vocab_v2/vocab_relations.asp?lib=P02 . Detailed documentation will be published soon. The original datasets can be searched and downloaded from EMODnet Chemistry Download Service: https://emodnet-chemistry.maris.nl/search
-
EMODnet Chemistry aims to provide access to marine chemistry data sets and derived data products concerning eutrophication, ocean acidification and contaminants. The chemicals chosen reflect importance to the Marine Strategy Framework Directive (MSFD). This regional aggregated dataset contains all unrestricted EMODnet Chemistry data on contaminants; temperature, salinity and additional sampling parameters are included when available. The spatial coverage is the North East Atlantic Ocean with 2438 CDI records divided per matrices: 126 in biota (as time series), 1704 in water (as vertical profiles) and 608 in sediment (497 Vertical profiles and 111 Time series). For water data, vertical profiles temporal range is from 1974-11-22 to 2013-08-15. For sediment data, vertical profiles temporal range is from 1966-01-01 to 2007-06-30 and time series temporal range is from 1999-06-05 to 2014-10-21. For biota data, time series temporal range is from 1979-02-28 to 2019-03-07. Data were aggregated and quality controlled by ‘IFREMER / IDM / SISMER - Scientific Information Systems for the SEA’ from France. Regional datasets concerning contaminants are automatically harvested. Parameter names in these datasets are based on P01, BODC Parameter Usage Vocabulary, which is available at: http://seadatanet.maris2.nl/bandit/browse_step.php . Each measurement value has a quality flag indicator. The resulting data collections for each Sea Basin are harmonised, and the collections are quality controlled by EMODnet Chemistry Regional Leaders using ODV Software and following a common methodology for all Sea Regions. Harmonisation means that: (1) unit conversion is carried out to express contaminant concentrations with a limited set of measurement units (according to EU directives 2013/39/UE; Comm. Dec. EU 2017/848) and (2) merging of variables described by different “local names” ,but corresponding exactly to the same concepts in BODC P01 vocabulary. Detailed documentation is available at: https://doi.org/10.6092/8b52e8d7-dc92-4305-9337-7634a5cae3f4 Explore and extract data at: https://emodnet-chemistry.webodv.awi.de/contaminants%3EAtlantic The harmonised dataset can also be downloaded as ODV spreadsheet (TXT file), which is composed of metadata header followed by tab separated values. This worksheet can be imported to ODV Software for visualisation (More information can be found at: https://www.seadatanet.org/Software/ODV ). The same dataset is offered also as TXT file in a long/vertical format, in which each P01 measurement is a record line. Additionally, there are a series of columns that split P01 terms in subcomponents (measure, substance, CAS number, matrix...).This transposed format is more adapted to worksheet applications users (e.g. LibreOffice Calc). The original datasets can be searched and downloaded from EMODnet Chemistry Download Service: https://emodnet-chemistry.maris.nl/search
-
Moving 6-year analysis of Water_body_silicate in the Mediterranean Sea for each season: - winter: January-March, - spring: April-June, - summer: July-September, - autumn: October-December. Every year of the time dimension corresponds to the 6-year centered average of the season. 6-years periods span from 1965-1970 until 2014-2019. Observational data span from 1960 to 2019. Depth range (IODE standard depths): 1500.0, 1400.0, 1300.0, 1200.0, -1100.0, -1000.0, -900.0, -800.0, -700.0, -600.0, -500.0, -400.0, -300.0, -250.0, -200.0, -150.0, -125.0, -100.0, -75.0, -50.0, -30.0, -20.0, -10.0, -5.0, -0.0. Data Sources: observational data from SeaDataNet/EMODnet Chemistry Data Network. Description of DIVA analysis: Geostatistical data analysis by DIVA (Data-Interpolating Variational Analysis) tool. Profiles were interpolated at standard depths using weighted parabolic interpolation algorithm (Reiniger and Ross, 1968). GEBCO 1min topography is used for the contouring preparation. Analysed filed masked using relative error threshold 0.3 and 0.5. DIVA settings: A constant value for signal-to-noise ratio was used equal to 1. Correlation length was optimized and filtered vertically and a seasonally-averaged profile was used. 'log(data)-exp(analysis' transformation applied to the data prior to the analysis. Background field: the data mean value is subtracted from the data. Detrending of data: no. Advection constraint applied: no. Units: umol/l. The entire set of related maps can be found in the viewing service: http://ec.oceanbrowser.net/emodnet/ . Originators of Italian data sets-List of contributors: - Brunetti Fabio (OGS) - Cardin Vanessa, Bensi Manuel doi:10.6092/36728450-4296-4e6a-967d-d5b6da55f306 - Cardin Vanessa, Bensi Manuel, Ursella Laura, Siena Giuseppe doi:10.6092/f8e6d18e-f877-4aa5-a983-a03b06ccb987 - Cataletto Bruno (OGS) - Cinzia Comici Cinzia (OGS) - Civitarese Giuseppe (OGS) - DeVittor Cinzia (OGS) - Giani Michele (OGS) - Kovacevic Vedrana (OGS) - Mosetti Renzo (OGS) - Solidoro C.,Beran A.,Cataletto B.,Celussi M.,Cibic T.,Comici C.,Del Negro P.,De Vittor C.,Minocci M.,Monti M.,Fabbro C.,Falconi C.,Franzo A.,Libralato S.,Lipizer M.,Negussanti J.S.,Russel H.,Valli G., doi:10.6092/e5518899-b914-43b0-8139-023718aa63f5 - Celio Massimo (ARPA FVG) - Malaguti Antonella (ENEA) - Fonda Umani Serena (UNITS) - Bignami Francesco (ISAC/CNR) - Boldrini Alfredo (ISMAR/CNR) - Marini Mauro (ISMAR/CNR) - Miserocchi Stefano (ISMAR/CNR) - Zaccone Renata (IAMC/CNR) - Lavezza, R., Dubroca, L. F. C., Ludicone, D., Kress, N., Herut, B., Civitarese, G., Cruzado, A., Lefèvre, D., Souvermezoglou, E., Yilmaz, A., Tugrul, S., and Ribera d'Alcala, M.: Compilation of quality controlled nutrient profiles from the Mediterranean Sea, doi:10.1594/PANGAEA.771907, 2011.
-
Moving 6-year analysis of Water_body_phosphate in the Mediterranean Sea for each season: - winter: January-March, - spring: April-June, - summer: July-September, - autumn: October-December. Every year of the time dimension corresponds to the 6-year centered average of the season. 6-years periods span from 1968-1973 until 2014-2019. Observational data span from 1960 to 2019. Depth range (IODE standard depths): 1500.0, 1400.0, 1300.0, 1200.0, -1100.0, -1000.0, -900.0, -800.0, -700.0, -600.0, -500.0, -400.0, -300.0, -250.0, -200.0, -150.0, -125.0, -100.0, -75.0, -50.0, -30.0, -20.0, -10.0, -5.0, -0.0. Data Sources: observational data from SeaDataNet/EMODnet Chemistry Data Network. Description of DIVA analysis: Geostatistical data analysis by DIVA (Data-Interpolating Variational Analysis) tool. Profiles were interpolated at standard depths using weighted parabolic interpolation algorithm (Reiniger and Ross, 1968). GEBCO 1min topography is used for the contouring preparation. Analysed filed masked using relative error threshold 0.3 and 0.5. DIVA settings: A constant value for signal-to-noise ratio was used equal to 1. Correlation length was optimized and filtered vertically and a seasonally-averaged profile was used. 'log(data)-exp(analysis' transformation applied to the data prior to the analysis. Background field: the data mean value is subtracted from the data. Detrending of data: no. Advection constraint applied: no. Units: umol/l. The entire set of related maps can be found in the viewing service: http://ec.oceanbrowser.net/emodnet/ . Originators of Italian data sets-List of contributors: - Brunetti Fabio (OGS) - Cardin Vanessa, Bensi Manuel doi:10.6092/36728450-4296-4e6a-967d-d5b6da55f306 - Cardin Vanessa, Bensi Manuel, Ursella Laura, Siena Giuseppe doi:10.6092/f8e6d18e-f877-4aa5-a983-a03b06ccb987 - Cataletto Bruno (OGS) - Cinzia Comici Cinzia (OGS) - Civitarese Giuseppe (OGS) - DeVittor Cinzia (OGS) - Giani Michele (OGS) - Kovacevic Vedrana (OGS) - Mosetti Renzo (OGS) - Solidoro C.,Beran A.,Cataletto B.,Celussi M.,Cibic T.,Comici C.,Del Negro P.,De Vittor C.,Minocci M.,Monti M.,Fabbro C.,Falconi C.,Franzo A.,Libralato S.,Lipizer M.,Negussanti J.S.,Russel H.,Valli G., doi:10.6092/e5518899-b914-43b0-8139-023718aa63f5 - Celio Massimo (ARPA FVG) - Malaguti Antonella (ENEA) - Fonda Umani Serena (UNITS) - Bignami Francesco (ISAC/CNR) - Boldrini Alfredo (ISMAR/CNR) - Marini Mauro (ISMAR/CNR) - Miserocchi Stefano (ISMAR/CNR) - Zaccone Renata (IAMC/CNR) - Lavezza, R., Dubroca, L. F. C., Ludicone, D., Kress, N., Herut, B., Civitarese, G., Cruzado, A., Lefèvre, D., Souvermezoglou, E., Yilmaz, A., Tugrul, S., and Ribera d'Alcala, M.: Compilation of quality controlled nutrient profiles from the Mediterranean Sea, doi:10.1594/PANGAEA.771907, 2011.
-
Moving 6-year analysis of Water_body_dissolved_oxygen_concentration in the Mediterranean Sea for each season: - winter: January-March, - spring: April-June, - summer: July-September, - autumn: October-December. Every year of the time dimension corresponds to the 6-year centered average of the season. 6-years periods span from 1971-1976 until 2014-2019. Observational data span from 1960 to 2019. Depth range (IODE standard depths): 2000.0, 1750.0, 1500.0, 1400.0, 1300.0, 1200.0, -1100.0, -1000.0, -900.0, -800.0, -700.0, -600.0, -500.0, -400.0, -300.0, -250.0, -200.0, -150.0, -125.0, -100.0, -75.0, -50.0, -30.0, -20.0, -10.0, -5.0, -0.0. Data Sources: observational data from SeaDataNet/EMODnet Chemistry Data Network. Description of DIVA analysis: Geostatistical data analysis by DIVA (Data-Interpolating Variational Analysis) tool. Profiles were interpolated at standard depths using weighted parabolic interpolation algorithm (Reiniger and Ross, 1968). GEBCO 1min topography is used for the contouring preparation. Analysed filed masked using relative error threshold 0.3 and 0.5. DIVA settings: A constant value for signal-to-noise ratio was used equal to 1. Correlation length was optimized and filtered vertically and a seasonally-averaged profile was used. 'log(data)-exp(analysis' transformation applied to the data prior to the analysis. Background field: the data mean value is subtracted from the data. Detrending of data: no. Advection constraint applied: no. Units: umol/l. The entire set of related maps can be found in the viewing service: http://ec.oceanbrowser.net/emodnet/ . Originators of Italian data sets-List of contributors: - Brunetti Fabio (OGS) - Cardin Vanessa, Bensi Manuel doi:10.6092/36728450-4296-4e6a-967d-d5b6da55f306 - Cardin Vanessa, Bensi Manuel, Ursella Laura, Siena Giuseppe doi:10.6092/f8e6d18e-f877-4aa5-a983-a03b06ccb987 - Cataletto Bruno (OGS) - Cinzia Comici Cinzia (OGS) - Civitarese Giuseppe (OGS) - DeVittor Cinzia (OGS) - Giani Michele (OGS) - Kovacevic Vedrana (OGS) - Mosetti Renzo (OGS) - Solidoro C.,Beran A.,Cataletto B.,Celussi M.,Cibic T.,Comici C.,Del Negro P.,De Vittor C.,Minocci M.,Monti M.,Fabbro C.,Falconi C.,Franzo A.,Libralato S.,Lipizer M.,Negussanti J.S.,Russel H.,Valli G., doi:10.6092/e5518899-b914-43b0-8139-023718aa63f5 - Celio Massimo (ARPA FVG) - Malaguti Antonella (ENEA) - Fonda Umani Serena (UNITS) - Bignami Francesco (ISAC/CNR) - Boldrini Alfredo (ISMAR/CNR) - Marini Mauro (ISMAR/CNR) - Miserocchi Stefano (ISMAR/CNR) - Zaccone Renata (IAMC/CNR) - Lavezza, R., Dubroca, L. F. C., Ludicone, D., Kress, N., Herut, B., Civitarese, G., Cruzado, A., Lefèvre, D., Souvermezoglou, E., Yilmaz, A., Tugrul, S., and Ribera d'Alcala, M.: Compilation of quality controlled nutrient profiles from the Mediterranean Sea, doi:10.1594/PANGAEA.771907, 2011.
-

The SDC_MED_CLIM_TS_V2 product contains Temperature and Salinity Climatologies for Mediterranean Sea: monthly and seasonal fields for time periods 1955-2018, 1955-1984 and 1985-2018 and seasonal fields for 6 decades covering the time period 1955 to 2018. The climatic fields were computed from an integrated Mediterranean Sea data set that combines data extracted from SeaDataNet infrastructure (SDC_MED_DATA_TS_V2, https://doi.org/10.12770/2a2aa0c5-4054-4a62-a18b-3835b304fe64) and Coriolis Ocean Dataset for Reanalysis (CORA5.2) distributed by the Copernicus Marine Service (INSITU_GLO_TS_REP_OBSERVATIONS_013_001_b). The computation was done with the DIVAnd (Data-Interpolating Variational Analysis), version 2.4.0.
-
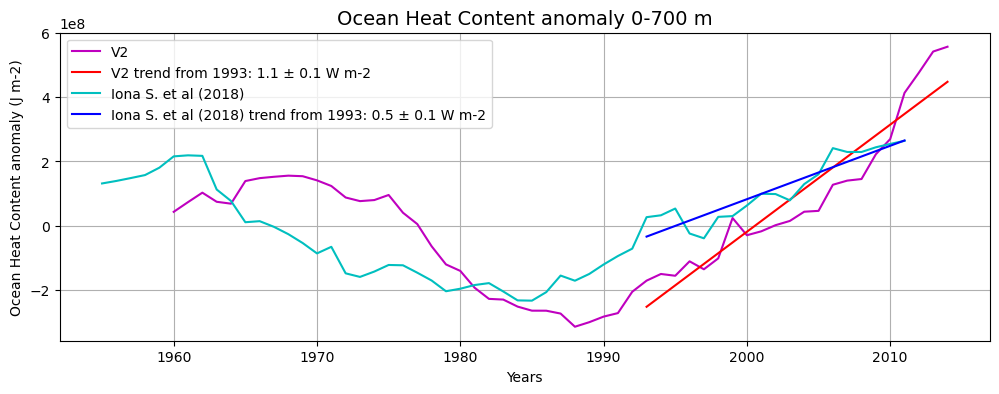
The SDC_MED_DP2 product contains 55 sliding decadal temperature fields (1955-1964, 1956-1965, 1957-1966, …, 2009-2018) at 1/8° horizontal resolution obtained in the 0-2000m layer and two derived OHC annual anomaly estimates for the 0-700m and the 0-2000m layers. Sliding decades of annual Temperature fields were obtained from an integrated Mediterranean Sea dataset covering the time period 1955-2018, which combines data extracted from SeaDataNet infrastructure at the end of July 2019 (SDC_MED_DATA_TS_V2, https://doi.org/10.12770/3f8eaace-9f9b-4b1b-a7a4-9c55270e205a) and the Coriolis Ocean Dataset for Reanalysis (CORA 5.2, accessed in July 2020, https://archimer.ifremer.fr/doc/00595/70726/). The resulting annual OHC anomaly time series span the 1960-2014 period. The analysis was performed with the DIVAnd (Data-Interpolating Variational Analysis in n dimensions), version 2.6.1.
-
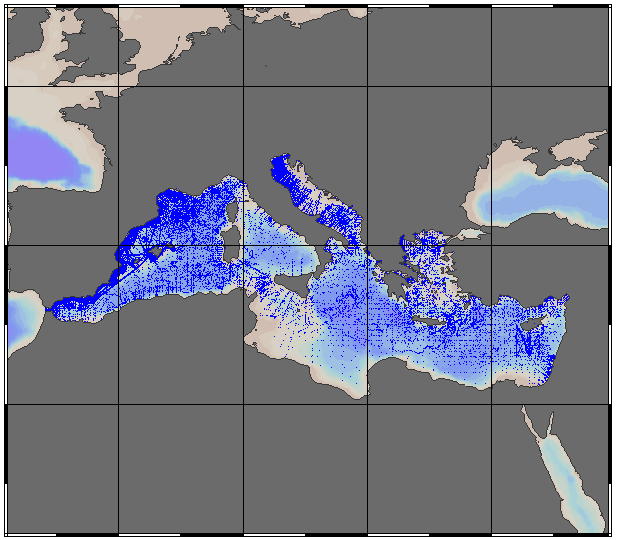
EMODnet Chemistry aims to provide access to marine chemistry data sets and derived data products concerning eutrophication, acidity and contaminants. The chemicals chosen reflect importance to the Marine Strategy Framework Directive (MSFD). ITS-90 water temperature and Water body salinity variables have been also included (as-is) to complete the Eutrophication and Acidity data. If you use these variables for calculations, please refer to SeaDataNet for having the quality flags: https://www.seadatanet.org/Products/Aggregated-datasets . This aggregated dataset contains all unrestricted EMODnet Chemistry data on Eutrophication and Acidity (15 parameters with quality flag indicators), and covers the Mediterranean Sea with 187722 CDI records (180932 Vertical profiles and 6790 Time series). Vertical profiles temporal range is from 1911-08-17 to 2020-10-16. Time series temporal range is from 1974-06-04 to 2018-02-20. Data were aggregated and quality controlled by 'Hellenic Centre for Marine Research, Hellenic National Oceanographic Data Centre (HCMR/HNODC)' from Greece. Regional datasets concerning eutrophication and acidity are automatically harvested and resulting collections are aggregated and quality controlled using ODV Software and following a common methodology for all Sea Regions ( https://doi.org/10.6092/9f75ad8a-ca32-4a72-bf69-167119b2cc12). When not present in original data, Water body nitrate plus nitrite was calculated by summing up the Nitrates and Nitrites. Same procedure was applied for Water body dissolved inorganic nitrogen (DIN) which was calculated by summing up the Nitrates, Nitrites and Ammonium. Parameter names are based on P35, EMODnet Chemistry aggregated parameter names vocabulary, which is available at: https://www.bodc.ac.uk/resources/vocabularies/vocabulary_search/P35/. Detailed documentation is available at: https://dx.doi.org/10.6092/4e85717a-a2c9-454d-ba0d-30b89f742713 Explore and extract data at: https://emodnet-chemistry.webodv.awi.de/eutrophication%3EMediterranean The aggregated dataset can also be downloaded as ODV collection and spreadsheet, which is composed of metadata header followed by tab separated values. This spreadsheet can be imported to ODV Software for visualisation (More information can be found at: https://www.seadatanet.org/Software/ODV ). The original datasets can be searched and downloaded from EMODnet Chemistry Download Service: https://emodnet-chemistry.maris.nl/search
-
The SDC_MED_CLIM_TS_V1 product contains Temperature and Salinity Climatologies for Mediterranean Sea: monthly and seasonal fields for periods 1955-2017, 1955-1984 and 1985-2017 and seasonal fields for 6 decades covering the time period 1955 to 2017. The climatic fields were computed from an integrated Mediterranean Sea data set that combines data extracted from SeaDataNet infrastructure (https://doi.org/10.12770/2698a37e-c78b-4f78-be0b-ec536c4cb4b3) and Coriolis Ocean Dataset for Reanalysis (CORA5.2) distributed by the Copernicus Marine Service (http://marine.copernicus.eu/services-portfolio/access-to-products/?option=com_csw&view=details&product_id=INSITU_GLO_TS_REP_OBSERVATIONS_013_001_b). The computation was done with the DIVAnd (Data-Interpolating Variational Analysis in n dimensions), version 2.4.0.
-
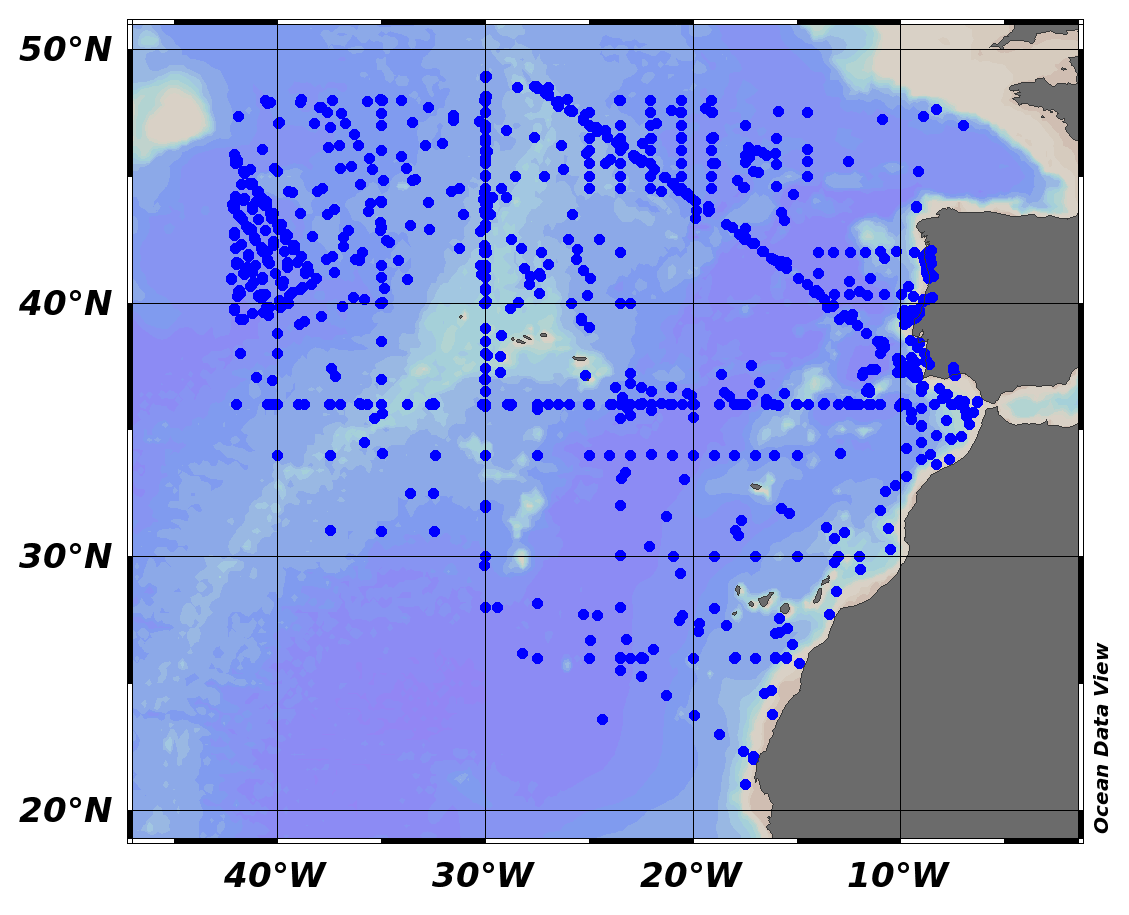
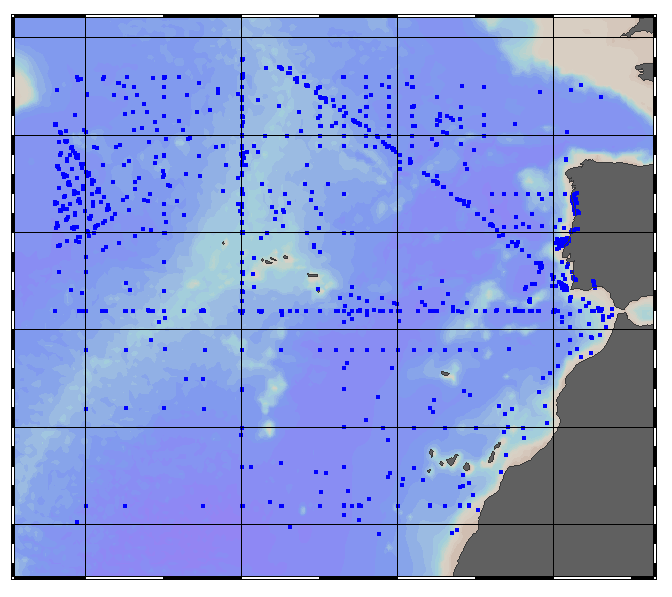
This product displays the stations present in EMODnet validated dataset where anthracene levels have been measured in sediment. EMODnet Chemistry has included the gathering of contaminants data since the beginning of the project in 2009. For the maps for EMODnet Chemistry Phase III, it was requested to plot data per matrix (water,sediment, biota), per biological entity and per chemical substance. The series of relevant map products have been developed according to the criteria D8C1 of the MSFD Directive, specifically focusing on the requirements under the new Commission Decision 2017/848 (17th May 2017). The Commission Decision points to relevant threshold values that are specified in the WFD, as well as relating how these contaminants should be expressed (units and matrix etc.) through the related Directives i.e. Priority substances for Water. EU EQS Directive does not fix any threshold values in sediments. On the contrary Regional Sea Conventions provide some of them, and these values have been taken into account for the development of the visualization products. To produce the maps the following process has been followed: 1. Data collection through SeaDataNet standards (CDI+ODV) 2. Harvesting, harmonization, validation and P01 code decomposition of data 3. SQL query on data sets from point 2 4. Production of map with each point representing at least one record that match the criteria The harmonization of all the data has been the most challenging task considering the heterogeneity of the data sources, sampling protocols. Preliminary processing were necessary to harmonize all the data : • For water: contaminants in the dissolved phase; • For sediment: data on total sediment (regardless of size class) or size class < 2000 μm • For biota: contaminant data will focus on molluscs, on fish (only in the muscle), and on crustaceans • Exclusion of data values equal to 0