 Metadata catalogue
GEOMAR Helmholtz Centre for Ocean Research Kiel
Type of resources
Available actions
Topics
INSPIRE themes
Keywords
Contact for the resource
Provided by
Years
Formats
Representation types
Scale
Resolution
-
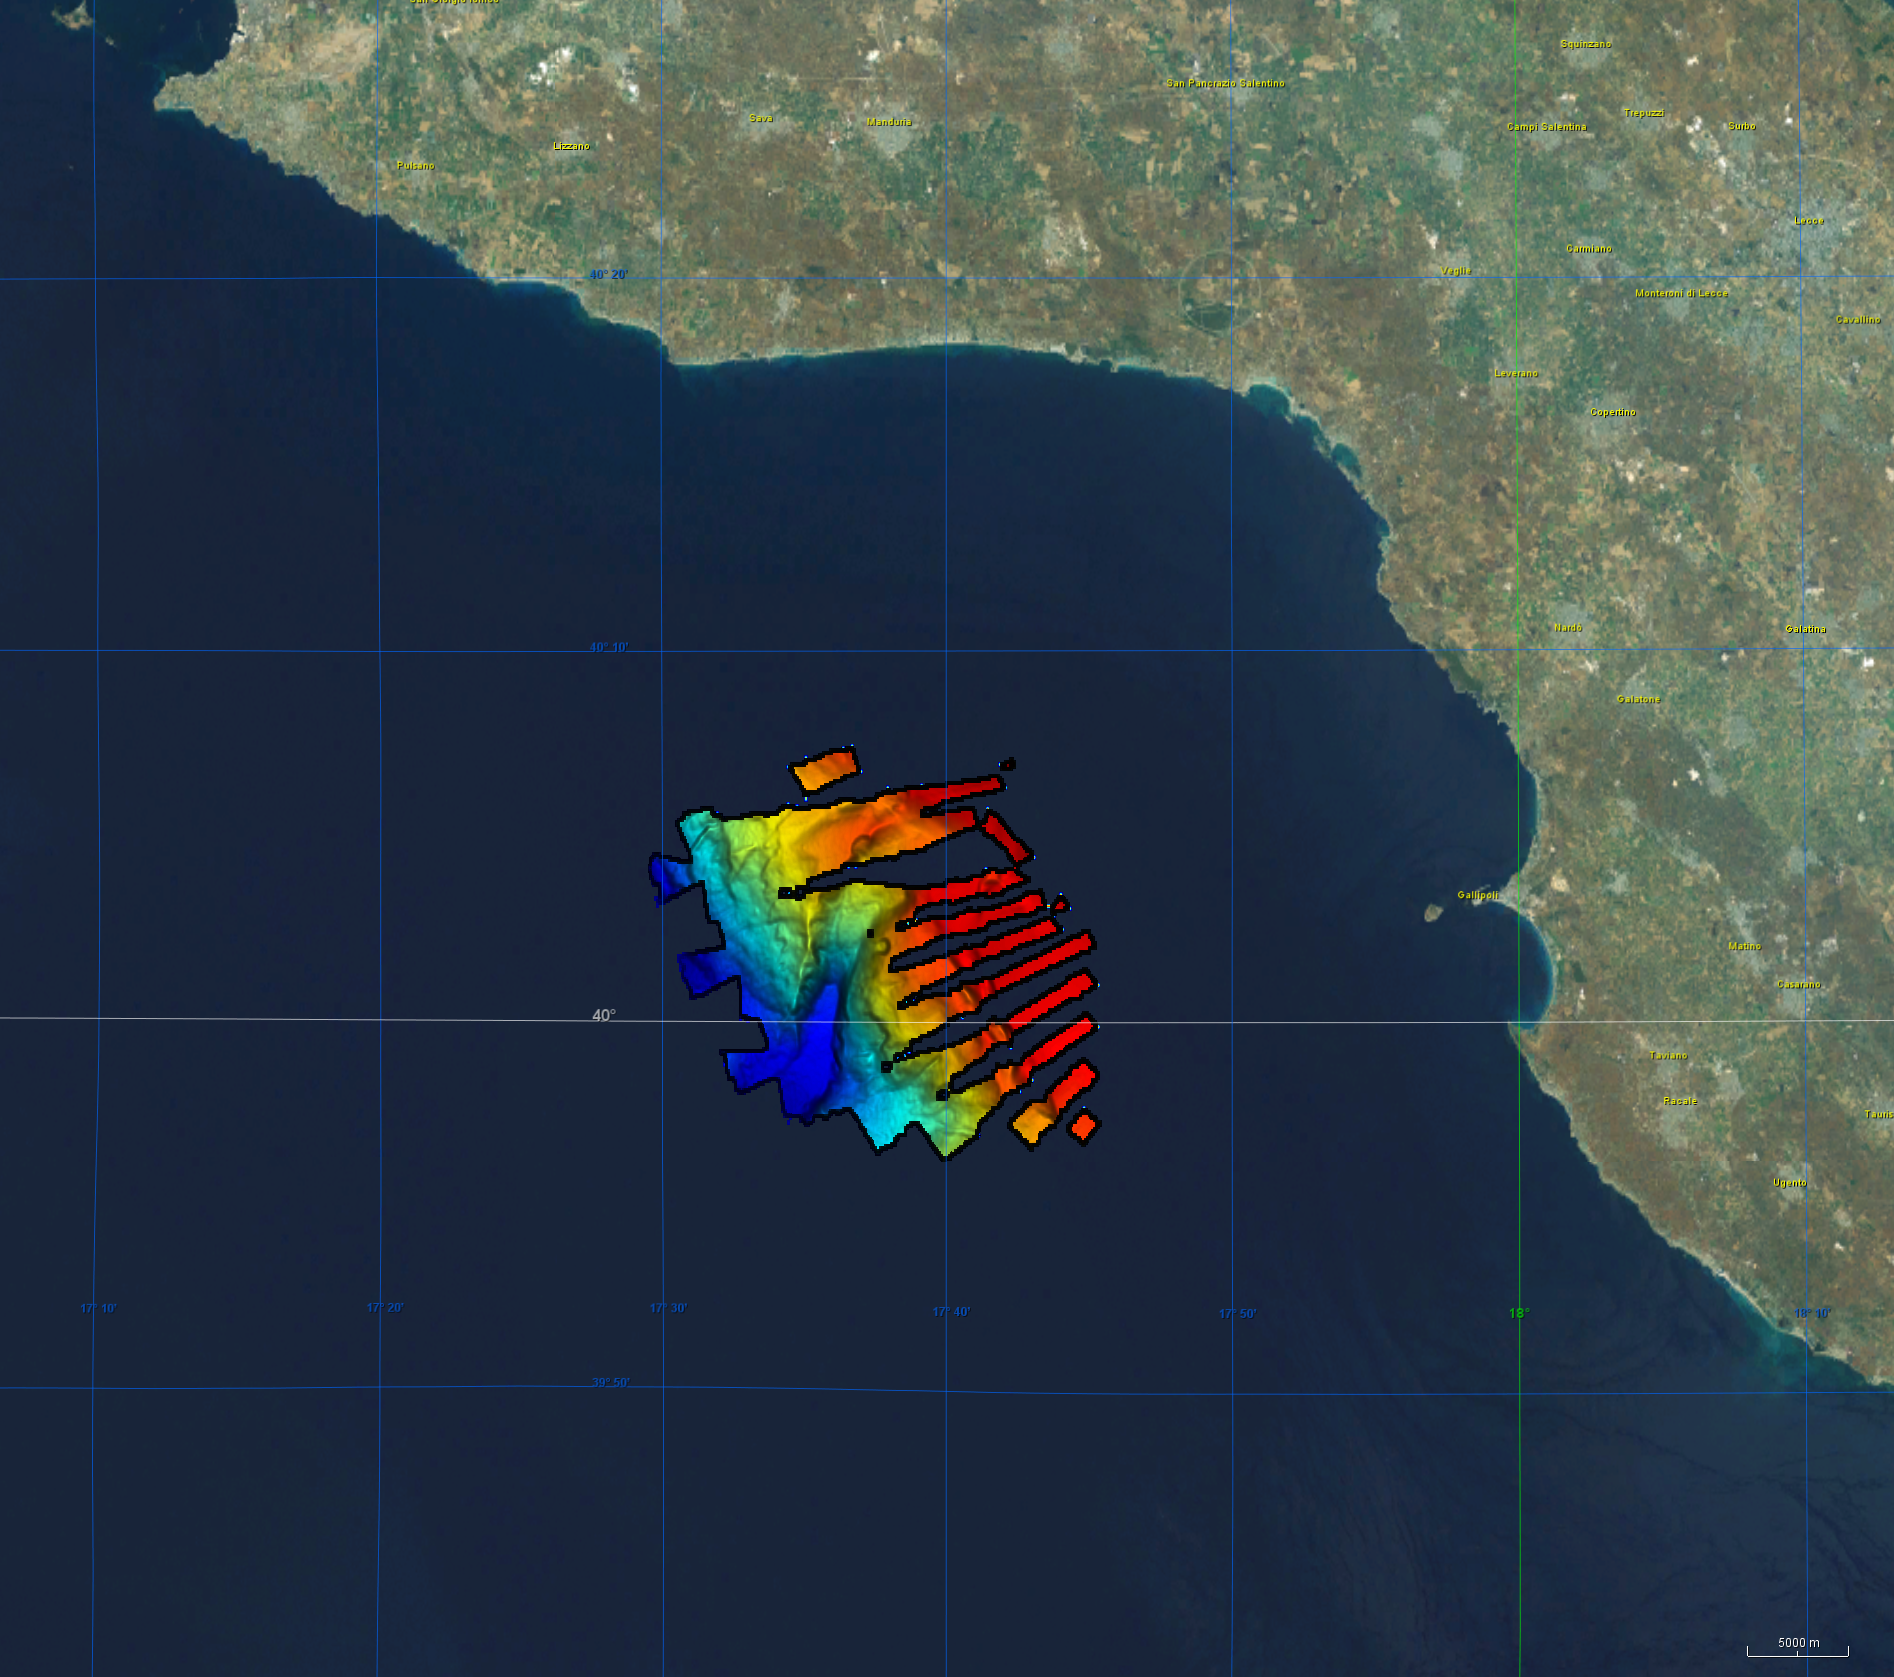
Bathymetry data was acquired during R/V Meteor cruise M144/1 in the aegean region of the Mediterranean Sea between 27.12.2017 and 18.01.2018. The cruise aimed to clarify the causal links between climate and ecosystem change on the one hand by sociocultural evolution on the other hand by climatic and environmental change that can be aligned with the archeological record. CI Citation: Paul Wintersteller (seafloor-imaging@marum.de) as responsible party for bathymetry raw data ingest and approval. Description of data source: During the M144/1 cruise, the hull-mounted KONGSBERG EM122 multibeam ecosounder (MBES) was utilized to perform bathymetric mapping in medium to deep waters. Two linear transducer arrays in a Mills Cross configuration transmit acoustic signals of a nominal sonar frequency of 12 kHz. With 432 soundings per swath, the emission cone has a dimension of max 150° across track and 1° along track. With a reception obtained from 288 beams, the actual beam footprint is 1° by 2°. Depending on the roughness of the seafloor and the water depth, the swath width on a flat bottom is maximum six times the water depth. For further information on the system, consult https://www.km.kongsberg.com/. The position and depth of the water column is estimated for each beam by using the detected two-way-travel time and the beam angle, ray-traced through the water column, utilizing a proper sound speed profile. Throughout this cruise the swath width was mainly at 120° and did not exceed 130°. Responsible person during this cruise / PI: unstated.
-
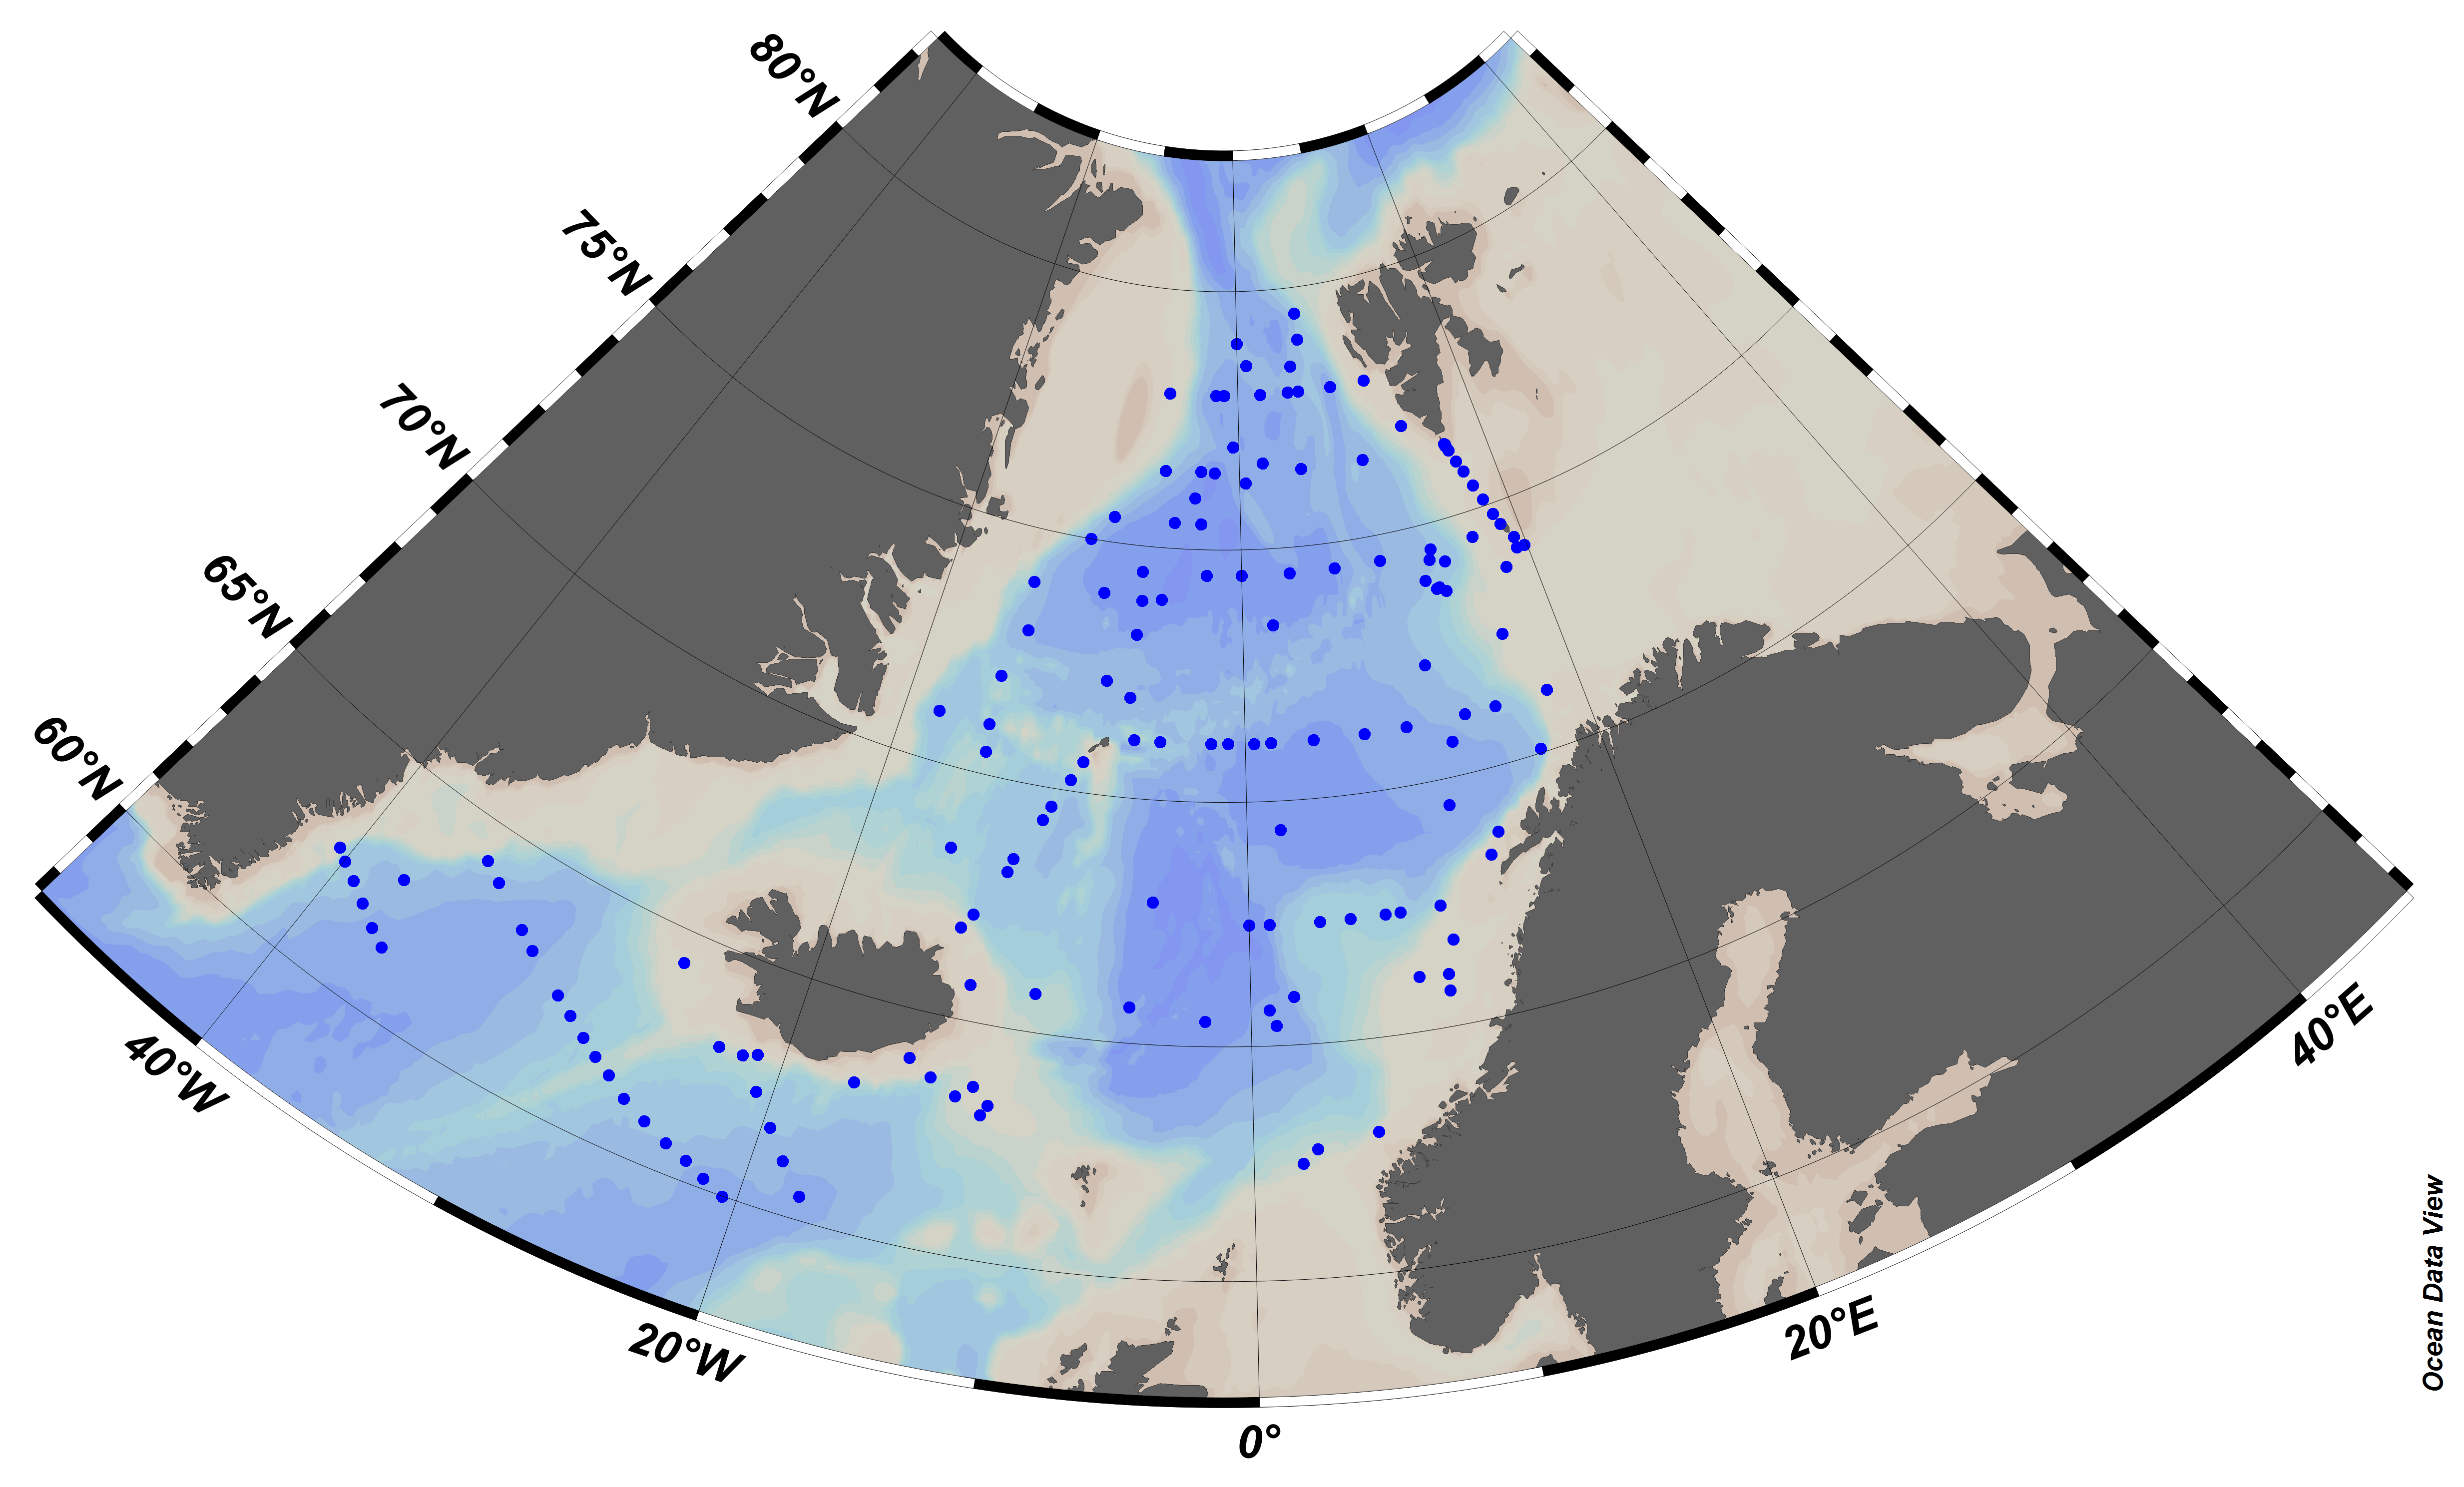
EMODnet Chemistry aims to provide access to marine chemistry data sets and derived data products concerning eutrophication, ocean acidification and contaminants. The chemicals chosen reflect importance to the Marine Strategy Framework Directive (MSFD). This regional aggregated dataset contains all unrestricted EMODnet Chemistry data on contaminants (20 parameters), and covers the Arctic Ocean with 548 CDI records divided per matrices: 235 water profiles, 313 sediment profiles. Vertical profiles temporal range is from 1974-03-25 to 2015-06-15. Data were aggregated and quality controlled by ‘Institute of Marine Research - Norwegian Marine Data Centre (NMD)’ from Norway. Regional datasets concerning contaminants are automatically harvested. Parameter names in these datasets are based on P01, BODC Parameter Usage Vocabulary, which is available at: http://seadatanet.maris2.nl/bandit/browse_step.php . Each measurement value has a quality flag indicator. The resulting data collections for each Sea Basin are harmonised, and the collections are quality controlled by EMODnet Chemistry Regional Leaders using ODV Software and following a common methodology for all Sea Regions. Harmonisation means that: (1) unit conversion is carried out to express contaminant concentrations with a limited set of measurement units (according to EU directives 2013/39/UE; Comm. Dec. EU 2017/848) and (2) merging of variables described by different “local names” ,but corresponding exactly to the same concepts in BODC P01 vocabulary. The harmonised dataset can be downloaded as ODV spreadsheet (TXT file), which is composed of metadata header followed by tab separated values. This worksheet can be imported to ODV Software for visualisation (More information can be found at: https://www.seadatanet.org/Software/ODV ). The same dataset is offered also as XLSX file in a long/vertical format, in which each P01 measurement is a record line. Additionally, there are a series of columns that split P01 terms in subcomponents (measure, substance, CAS number, matrix...).This transposed format is more adapted to worksheet applications users (e.g. LibreOffice Calc). The 20 parameter names in this metadata record are based on P02, SeaDataNet Parameter Discovery Vocabulary, which is available at: http://seadatanet.maris2.nl/v_bodc_vocab_v2/vocab_relations.asp?lib=P02 . Detailed documentation will be published soon. The original datasets can be searched and downloaded from EMODnet Chemistry Download Service: https://emodnet-chemistry.maris.nl/search
-
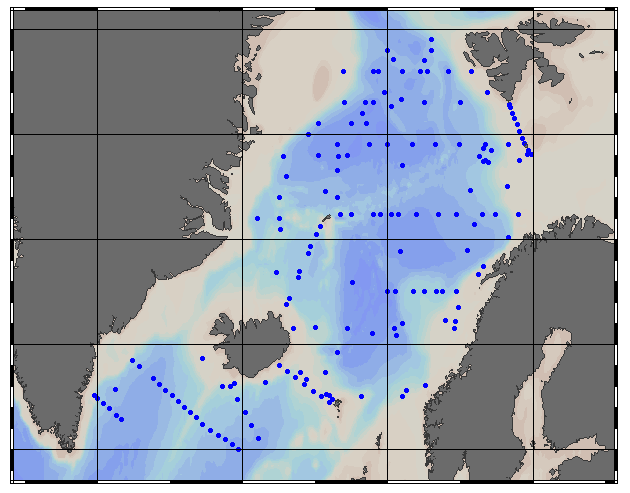
EMODnet Chemistry aims to provide access to marine chemistry data sets and derived data products concerning eutrophication, ocean acidification and contaminants. The chemicals chosen reflect importance to the Marine Strategy Framework Directive (MSFD). This regional aggregated dataset contains all unrestricted EMODnet Chemistry data on contaminants; temperature, salinity and additional sampling parameters are included when available. The spatial coverage is the Arctic Ocean with 780 CDI records divided per matrices: 249 water profiles and 531 sediment profiles. For water, vertical profiles temporal range is from 1974-03-25 to 2011-08-24. For sediment, vertical profiles temporal range is from 1974-08-07 to 2017-10-26. Data were aggregated and quality controlled by ‘Institute of Marine Research - Norwegian Marine Data Centre (NMD)’ from Norway. Regional datasets concerning contaminants are automatically harvested. Parameter names in these datasets are based on P01, BODC Parameter Usage Vocabulary, which is available at: http://seadatanet.maris2.nl/bandit/browse_step.php . Each measurement value has a quality flag indicator. The resulting data collections for each Sea Basin are harmonised, and the collections are quality controlled by EMODnet Chemistry Regional Leaders using ODV Software and following a common methodology for all Sea Regions. Harmonisation means that: (1) unit conversion is carried out to express contaminant concentrations with a limited set of measurement units (according to EU directives 2013/39/UE; Comm. Dec. EU 2017/848) and (2) merging of variables described by different “local names” ,but corresponding exactly to the same concepts in BODC P01 vocabulary. Detailed documentation is available at: https://doi.org/10.6092/8b52e8d7-dc92-4305-9337-7634a5cae3f4 Explore and extract data at: https://emodnet-chemistry.webodv.awi.de/contaminants%3EArctic The harmonised dataset can also be downloaded as ODV spreadsheet (TXT file), which is composed of metadata header followed by tab separated values. This worksheet can be imported to ODV Software for visualisation (More information can be found at: https://www.seadatanet.org/Software/ODV ). The same dataset is offered also as TXT file in a long/vertical format, in which each P01 measurement is a record line. Additionally, there are a series of columns that split P01 terms in subcomponents (measure, substance, CAS number, matrix...).This transposed format is more adapted to worksheet applications users (e.g. LibreOffice Calc). The original datasets can be searched and downloaded from EMODnet Chemistry Download Service: https://emodnet-chemistry.maris.nl/search
-
EMODnet Chemistry aims to provide access to marine chemistry data sets and derived data products concerning eutrophication, ocean acidification and contaminants. The chemicals chosen reflect importance to the Marine Strategy Framework Directive (MSFD). This regional aggregated dataset contains all unrestricted EMODnet Chemistry data on contaminants (20 parameters), and covers the North East Atlantic Ocean with 2400 CDI records divided per matrices: 122 in biota (as time series), 1689 in water (as vertical profiles), 589 in sediment (478 Vertical profiles and 111 Time series). Vertical profiles temporal range is from 1970-07-29 to 2017-02-28. Time series temporal range is from 1979-02-28 to 2014-10-21. Data were aggregated and quality controlled by ‘IFREMER / IDM / SISMER - Scientific Information Systems for the SEA’ from France. Regional datasets concerning contaminants are automatically harvested. Parameter names in these datasets are based on P01, BODC Parameter Usage Vocabulary, which is available at: http://seadatanet.maris2.nl/bandit/browse_step.php . Each measurement value has a quality flag indicator. The resulting data collections for each Sea Basin are harmonised, and the collections are quality controlled by EMODnet Chemistry Regional Leaders using ODV Software and following a common methodology for all Sea Regions. Harmonisation means that: (1) unit conversion is carried out to express contaminant concentrations with a limited set of measurement units (according to EU directives 2013/39/UE; Comm. Dec. EU 2017/848) and (2) merging of variables described by different “local names” ,but corresponding exactly to the same concepts in BODC P01 vocabulary. The harmonised dataset can be downloaded as ODV spreadsheet (TXT file), which is composed of metadata header followed by tab separated values. This worksheet can be imported to ODV Software for visualisation (More information can be found at: https://www.seadatanet.org/Software/ODV ). The same dataset is offered also as XLSX file in a long/vertical format, in which each P01 measurement is a record line. Additionally, there are a series of columns that split P01 terms in subcomponents (measure, substance, CAS number, matrix...).This transposed format is more adapted to worksheet applications users (e.g. LibreOffice Calc). The 20 parameter names in this metadata record are based on P02, SeaDataNet Parameter Discovery Vocabulary, which is available at: http://seadatanet.maris2.nl/v_bodc_vocab_v2/vocab_relations.asp?lib=P02 . Detailed documentation will be published soon. The original datasets can be searched and downloaded from EMODnet Chemistry Download Service: https://emodnet-chemistry.maris.nl/search
-

Units: umol/l. Method: spatial interpolation produced with DIVA (Data-Interpolating Variational Analysis). URL: http://modb.oce.ulg.ac.be/DIVA. Comment: Every year of the time dimension corresponds to a 10-year centred average for each season : - winter season (December-February), - spring (March-May), - summer (June-August), - autumn (September-November). Diva settings: Snr=1.0, CL=0.7
-

SeaDataNet Temperature and Salinity historical data collection for the North Arctic Ocean, including revised quality flags after quality control with ODV. For data access please register at http://www.marine-id.org The dataset format is ODV binary collections. You can read, analyse and export from the ODV application provided by Alfred Wegener institute at http://odv.awi.de/
-
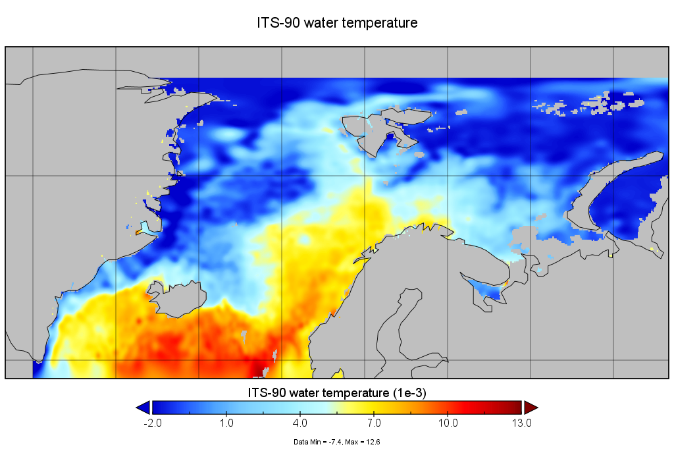
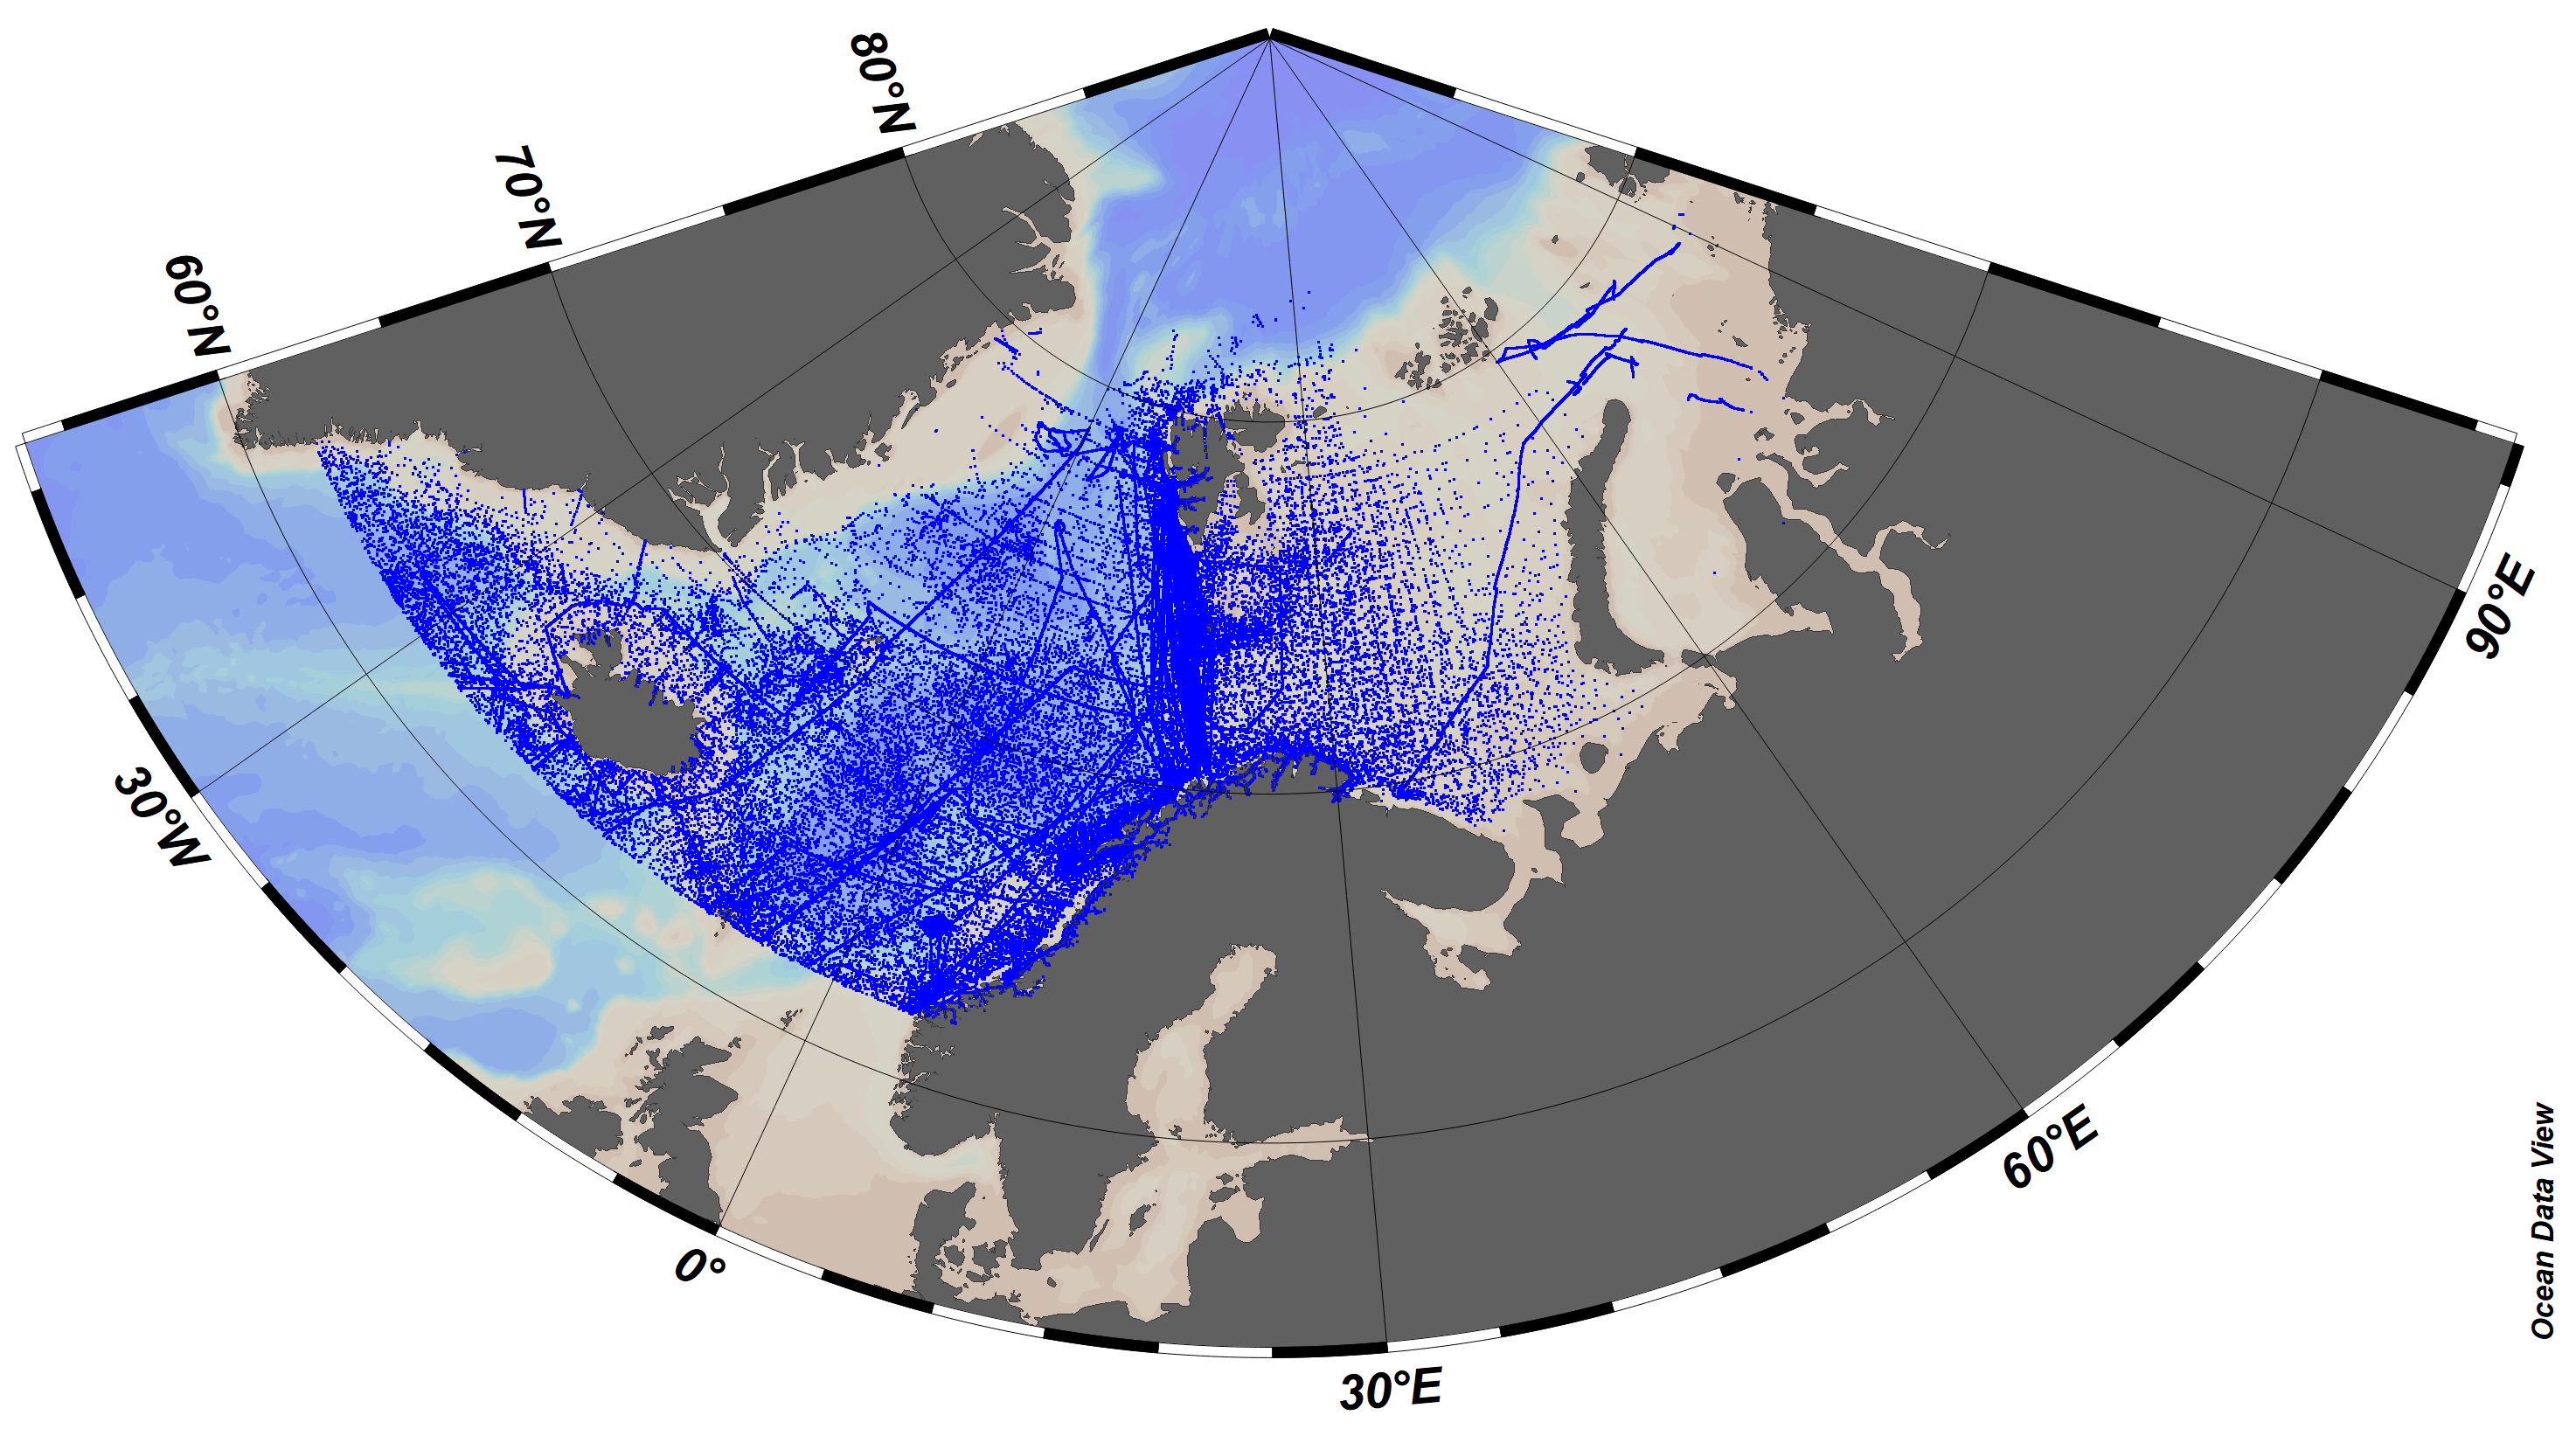
The SeaDataCloud Temperature and Salinity Climatologies have been processed from the historical Data Collection of the Arctic Ocean (from 56°N to 83°N and from 45°W to 70°E) including temperature and salinity in situ data of the water column for the period 1955 – 2019. The analysis was run in six decadal periods (1955-1964/1965-1974/1975-1984/1985-1994/1995-2004/2005-2014). A subset of the World Ocean Database 2018 (WOD18, https://www.nodc.noaa.gov/OC5/WOD/pr_wod.html) dataset has been integrated as external data-source to improve data availability for analysis.
-

This gridded product visualizes 1960 - 2014 water body ammonium concentration (umol/l) in the North Sea domain, for each season (winter: December – February; spring: March – May; summer: June – August; autumn: September – November). It is produced as a Diva 4D analysis, version 4.6.9: a reference field of all seasonal data between 1960-2014 was used; results were logit transformed to avoid negative/underestimated values in the interpolated results; error threshold masks L1 (0.3) and L2 (0.5) are included as well as the unmasked field. Every step of the time dimension corresponds to a 10-year moving average for each season. The depth dimension allows visualizing the gridded field at various depths.
-
SeaDataCloud Temperature and Salinity historical data collection for the Arctic Ocean, including revised quality flags after quality control with ODV. The dataset format is ODV binary collections. You can read, analyse and export from the ODV application provided by Alfred Wegener institute at http://odv.awi.de/. For data access please register at http://www.marine-id.org/.
-

This gridded product visualizes 1960 - 2014 water body nitrate concentration (umol/l) in the North Sea domain, for each season (winter: December – February; spring: March – May; summer: June – August; autumn: September – November). It is produced as a Diva 4D analysis, version 4.6.9: a reference field of all seasonal data between 1960-2014 was used; results were logit transformed to avoid negative/underestimated values in the interpolated results; error threshold masks L1 (0.3) and L2 (0.5) are included as well as the unmasked field. Every step of the time dimension corresponds to a 10-year moving average for each season. The depth dimension allows visualizing the gridded field at various depths.