 Metadata catalogue
Estonian Marine Institute
Type of resources
Available actions
Topics
INSPIRE themes
Keywords
Contact for the resource
Provided by
Years
Formats
Representation types
Scale
Resolution
-
Water body chlorophyll-a - Seasonal Climatology for Gulf of Riga for the period 1994-2019 on the domain: Lon 22.3-25.0°E, Lat 56.8-58.4°N. Data Sources: observational data from SeaDataNet/EMODnet Chemistry Data Network. Description of DIVA analysis: The computation was done with the DIVAnd (Data-Interpolating Variational Analysis in n dimensions), version 2.7, using GEBCO 30sec topography for the spatial connectivity of water masses. Horizontal correlation length of 25 km and vertical correlation length of 10 m. Depth range: 0.0, 2.5, 5, 10, 15, 20, 25, 30, 40, 50 m. Units: mg/m3. The horizontal resolution of the produced DIVAnd maps grids is 0.01 degrees.
-
Water body silicate - Seasonal Climatology for Gulf of Riga for the period 1994-2019 on the domain: Lon 22.3-25.0°E, Lat 56.8-58.4°N. Data Sources: observational data from SeaDataNet/EMODnet Chemistry Data Network. Description of DIVA analysis: The computation was done with the DIVAnd (Data-Interpolating Variational Analysis in n dimensions), version 2.7, using GEBCO 30sec topography for the spatial connectivity of water masses. Horizontal correlation length of 25 km and vertical correlation length of 10 m. Depth range: 0.0, 2.5, 5, 10, 15, 20, 25, 30, 40, 50 m. Units: µmol/l. The horizontal resolution of the produced DIVAnd maps grids is 0.01 degrees.
-
Water body dissolved inorganic nitrogen (DIN) - Seasonal Climatology for Gulf of Riga for the period 1994-2019 on the domain: Lon 22.3-25.0°E, Lat 56.8-58.4°N. Data Sources: observational data from SeaDataNet/EMODnet Chemistry Data Network. Description of DIVA analysis: The computation was done with the DIVAnd (Data-Interpolating Variational Analysis in n dimensions), version 2.7, using GEBCO 30sec topography for the spatial connectivity of water masses. Horizontal correlation length of 25 km and vertical correlation length of 10 m. Depth range: 0.0, 2.5, 5, 10, 15, 20, 25, 30, 40, 50 m. Units: µmol/l. The horizontal resolution of the produced DIVAnd maps grids is 0.01 degrees.
-
Water body dissolved oxygen concentration - Seasonal Climatology for Gulf of Riga for the period 1994-2019 on the domain: Lon 22.3-25.0°E, Lat 56.8-58.4°N. Data Sources: observational data from SeaDataNet/EMODnet Chemistry Data Network. Description of DIVA analysis: The computation was done with the DIVAnd (Data-Interpolating Variational Analysis in n dimensions), version 2.7, using GEBCO 30sec topography for the spatial connectivity of water masses. Horizontal correlation length of 25 km and vertical correlation length of 10 m. Depth range: 0.0, 2.5, 5, 10, 15, 20, 25, 30, 40, 50 m. Units: µmol/l. The horizontal resolution of the produced DIVAnd maps grids is 0.01 degrees.
-
Water body phosphate - Seasonal Climatology for Gulf of Riga for the period 1994-2018 on the domain: Lon 22.3-25.0°E, Lat 56.8-58.4°N. Data Sources: observational data from SeaDataNet/EMODnet Chemistry Data Network. Description of DIVA analysis: The computation was done with the DIVAnd (Data-Interpolating Variational Analysis in n dimensions), version 2.7, using GEBCO 30sec topography for the spatial connectivity of water masses. Horizontal correlation length of 25 km and vertical correlation length of 10 m. Depth range: 0.0, 2.5, 5, 10, 15, 20, 25, 30, 40, 50 m. Units: µmol/l. The horizontal resolution of the produced DIVAnd maps grids is 0.01 degrees.
-

Units: umol/l. Method: spatial interpolation produced with DIVA (Data-Interpolating Variational Analysis). URL: http://modb.oce.ulg.ac.be/DIVA. Comment: Every year of the time dimension corresponds to a 10-year centred average for each season : - winter season (December-February), - spring (March-May), - summer (June-August), - autumn (September-November). Diva settings: Snr=1.0, CL=0.7
-
EMODnet Chemistry aims to provide access to marine chemistry data sets and derived data products concerning eutrophication, ocean acidification and contaminants. The chemicals chosen reflect importance to the Marine Strategy Framework Directive (MSFD). This regional aggregated dataset contains all unrestricted EMODnet Chemistry data on contaminants (49 parameters), and covers the Baltic Sea with 3818 CDI records divided per matrices: 1358 biota (396 Vertical profiles and 962 Time series),906 water profiles, 2510 sediment profiles. Vertical profiles temporal range is from 1985-04-16 to 2016-09-27. Time series temporal range is from 1972-05-02 to 2017-10-30. Data were aggregated and quality controlled by ‘Swedish Meteorological and Hydrological Institute (SMHI)’ from Sweden. Regional datasets concerning contaminants are automatically harvested. Parameter names in these datasets are based on P01, BODC Parameter Usage Vocabulary, which is available at: http://seadatanet.maris2.nl/bandit/browse_step.php . Each measurement value has a quality flag indicator. The resulting data collections for each Sea Basin are harmonised, and the collections are quality controlled by EMODnet Chemistry Regional Leaders using ODV Software and following a common methodology for all Sea Regions. Harmonisation means that: (1) unit conversion is carried out to express contaminant concentrations with a limited set of measurement units (according to EU directives 2013/39/UE; Comm. Dec. EU 2017/848) and (2) merging of variables described by different “local names” ,but corresponding exactly to the same concepts in BODC P01 vocabulary. The harmonised dataset can be downloaded as ODV spreadsheet (TXT file), which is composed of metadata header followed by tab separated values. This worksheet can be imported to ODV Software for visualisation (More information can be found at: https://www.seadatanet.org/Software/ODV ). The same dataset is offered also as XLSX file in a long/vertical format, in which each P01 measurement is a record line. Additionally, there are a series of columns that split P01 terms in subcomponents (measure, substance, CAS number, matrix...).This transposed format is more adapted to worksheet applications users (e.g. LibreOffice Calc). The 49 parameter names in this metadata record are based on P02, SeaDataNet Parameter Discovery Vocabulary, which is available at: http://seadatanet.maris2.nl/v_bodc_vocab_v2/vocab_relations.asp?lib=P02 . Detailed documentation will be published soon. The original datasets can be searched and downloaded from EMODnet Chemistry Download Service: https://emodnet-chemistry.maris.nl/search
-
EMODnet Chemistry aims to provide access to marine chemistry data sets and derived data products concerning eutrophication, ocean acidification and contaminants. The chemicals chosen reflect importance to the Marine Strategy Framework Directive (MSFD). This regional aggregated dataset contains all unrestricted EMODnet Chemistry data on contaminants; temperature, salinity and additional sampling parameters are included when available. The spatial coverage is the Baltic Sea with 3186 CDI records divided per matrices: 808 water profiles, 1556 sediment profiles and 822 biota profiles. For water, vertical profiles temporal range is from 1999-05-15 to 2018-08-27. For sediment, vertical profiles temporal range is from 1974-04-25 to 2018-08-27. For biota, vertical profiles temporal range is from 1998-09-14 to 2018-10-01. Data were aggregated and quality controlled by ‘Swedish Meteorological and Hydrological Institute (SMHI)’ from Sweden. Regional datasets concerning contaminants are automatically harvested. Parameter names in these datasets are based on P01, BODC Parameter Usage Vocabulary, which is available at: http://seadatanet.maris2.nl/bandit/browse_step.php . Each measurement value has a quality flag indicator. The resulting data collections for each Sea Basin are harmonised, and the collections are quality controlled by EMODnet Chemistry Regional Leaders using ODV Software and following a common methodology for all Sea Regions. Harmonisation means that: (1) unit conversion is carried out to express contaminant concentrations with a limited set of measurement units (according to EU directives 2013/39/UE; Comm. Dec. EU 2017/848) and (2) merging of variables described by different “local names” ,but corresponding exactly to the same concepts in BODC P01 vocabulary. Detailed documentation is available at: https://doi.org/10.6092/8b52e8d7-dc92-4305-9337-7634a5cae3f4 Explore and extract data at: https://emodnet-chemistry.webodv.awi.de/contaminants%3EBaltic The harmonised dataset can also be downloaded as ODV spreadsheet (TXT file), which is composed of metadata header followed by tab separated values. This worksheet can be imported to ODV Software for visualisation (More information can be found at: https://www.seadatanet.org/Software/ODV ). The same dataset is offered also as XLSX file in a long/vertical format, in which each P01 measurement is a record line. Additionally, there are a series of columns that split P01 terms in subcomponents (measure, substance, CAS number, matrix...).This transposed format is more adapted to worksheet applications users (e.g. LibreOffice Calc). The original datasets can be searched and downloaded from EMODnet Chemistry Download Service: https://emodnet-chemistry.maris.nl/search
-

Units: umol/l. Method: spatial interpolation produced with DIVA (Data-Interpolating Variational Analysis). URL: http://modb.oce.ulg.ac.be/DIVA. Comment: Every year of the time dimension corresponds to a 10-year centred average for each season : - winter season (December-February), - spring (March-May), - summer (June-August), - autumn (September-November). Diva settings: Snr=1.0, CL=0.7.
-

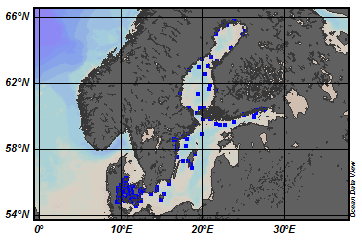
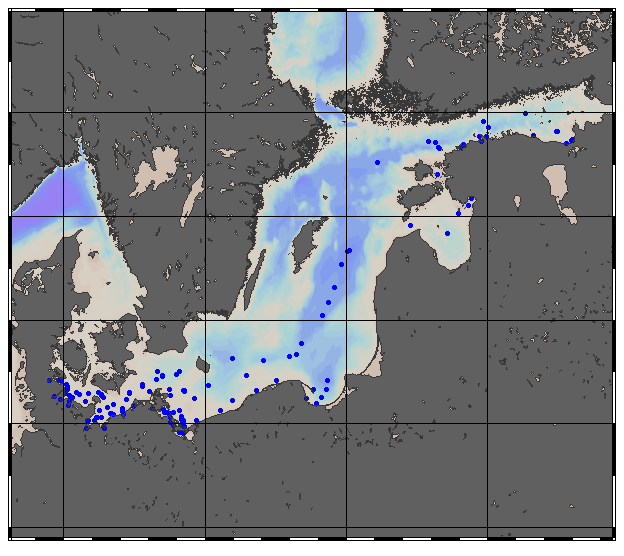
This visualization product displays plastic bags density per trawl. EMODnet Chemistry included the collection of marine litter in its 3rd phase. Since the beginning of 2018, data of seafloor litter collected by international fish-trawl surveys have been gathered and processed in the EMODnet Chemistry Marine Litter Database (MLDB). The harmonization of all the data has been the most challenging task considering the heterogeneity of the data sources, sampling protocols (OSPAR and MEDITS protocols) and reference lists used on a European scale. Moreover, within the same protocol, different gear types are deployed during fishing bottom trawl surveys. In cases where the wingspread and/or number of items were unknown, data could not be used because these fields are needed to calculate the density. Data collected before 2011 are affected by this filter. When the distance reported in the data was null, it was calculated from: - the ground speed and the haul duration using this formula: Distance (km) = Haul duration (h) * Ground speed (km/h); - the trawl coordinates if the ground speed and the haul duration were not filled in. The swept area is calculated from the wingspread (which depends on the fishing gear type) and the distance trawled: Swept area (km²) = Distance (km) * Wingspread (km) Densities have been calculated on each trawl and year using the following computation: Density of plastic bags (number of items per km²) = ∑Number of plastic bags related items / Swept area (km²) Percentiles 50, 75, 95 & 99 have been calculated taking into account data for all years. Plastic bags reference codes taken into account for this product and information on data processing and calculation are detailed in the document attached p22. Warning: the absence of data on the map doesn't necessarily mean that they don't exist, but that no information has been entered in the Marine Litter Database for this area.