 Metadata catalogue
British Oceanographic Data Centre
Type of resources
Available actions
Topics
INSPIRE themes
Keywords
Contact for the resource
Provided by
Years
Formats
Representation types
Update frequencies
Scale
Resolution
-
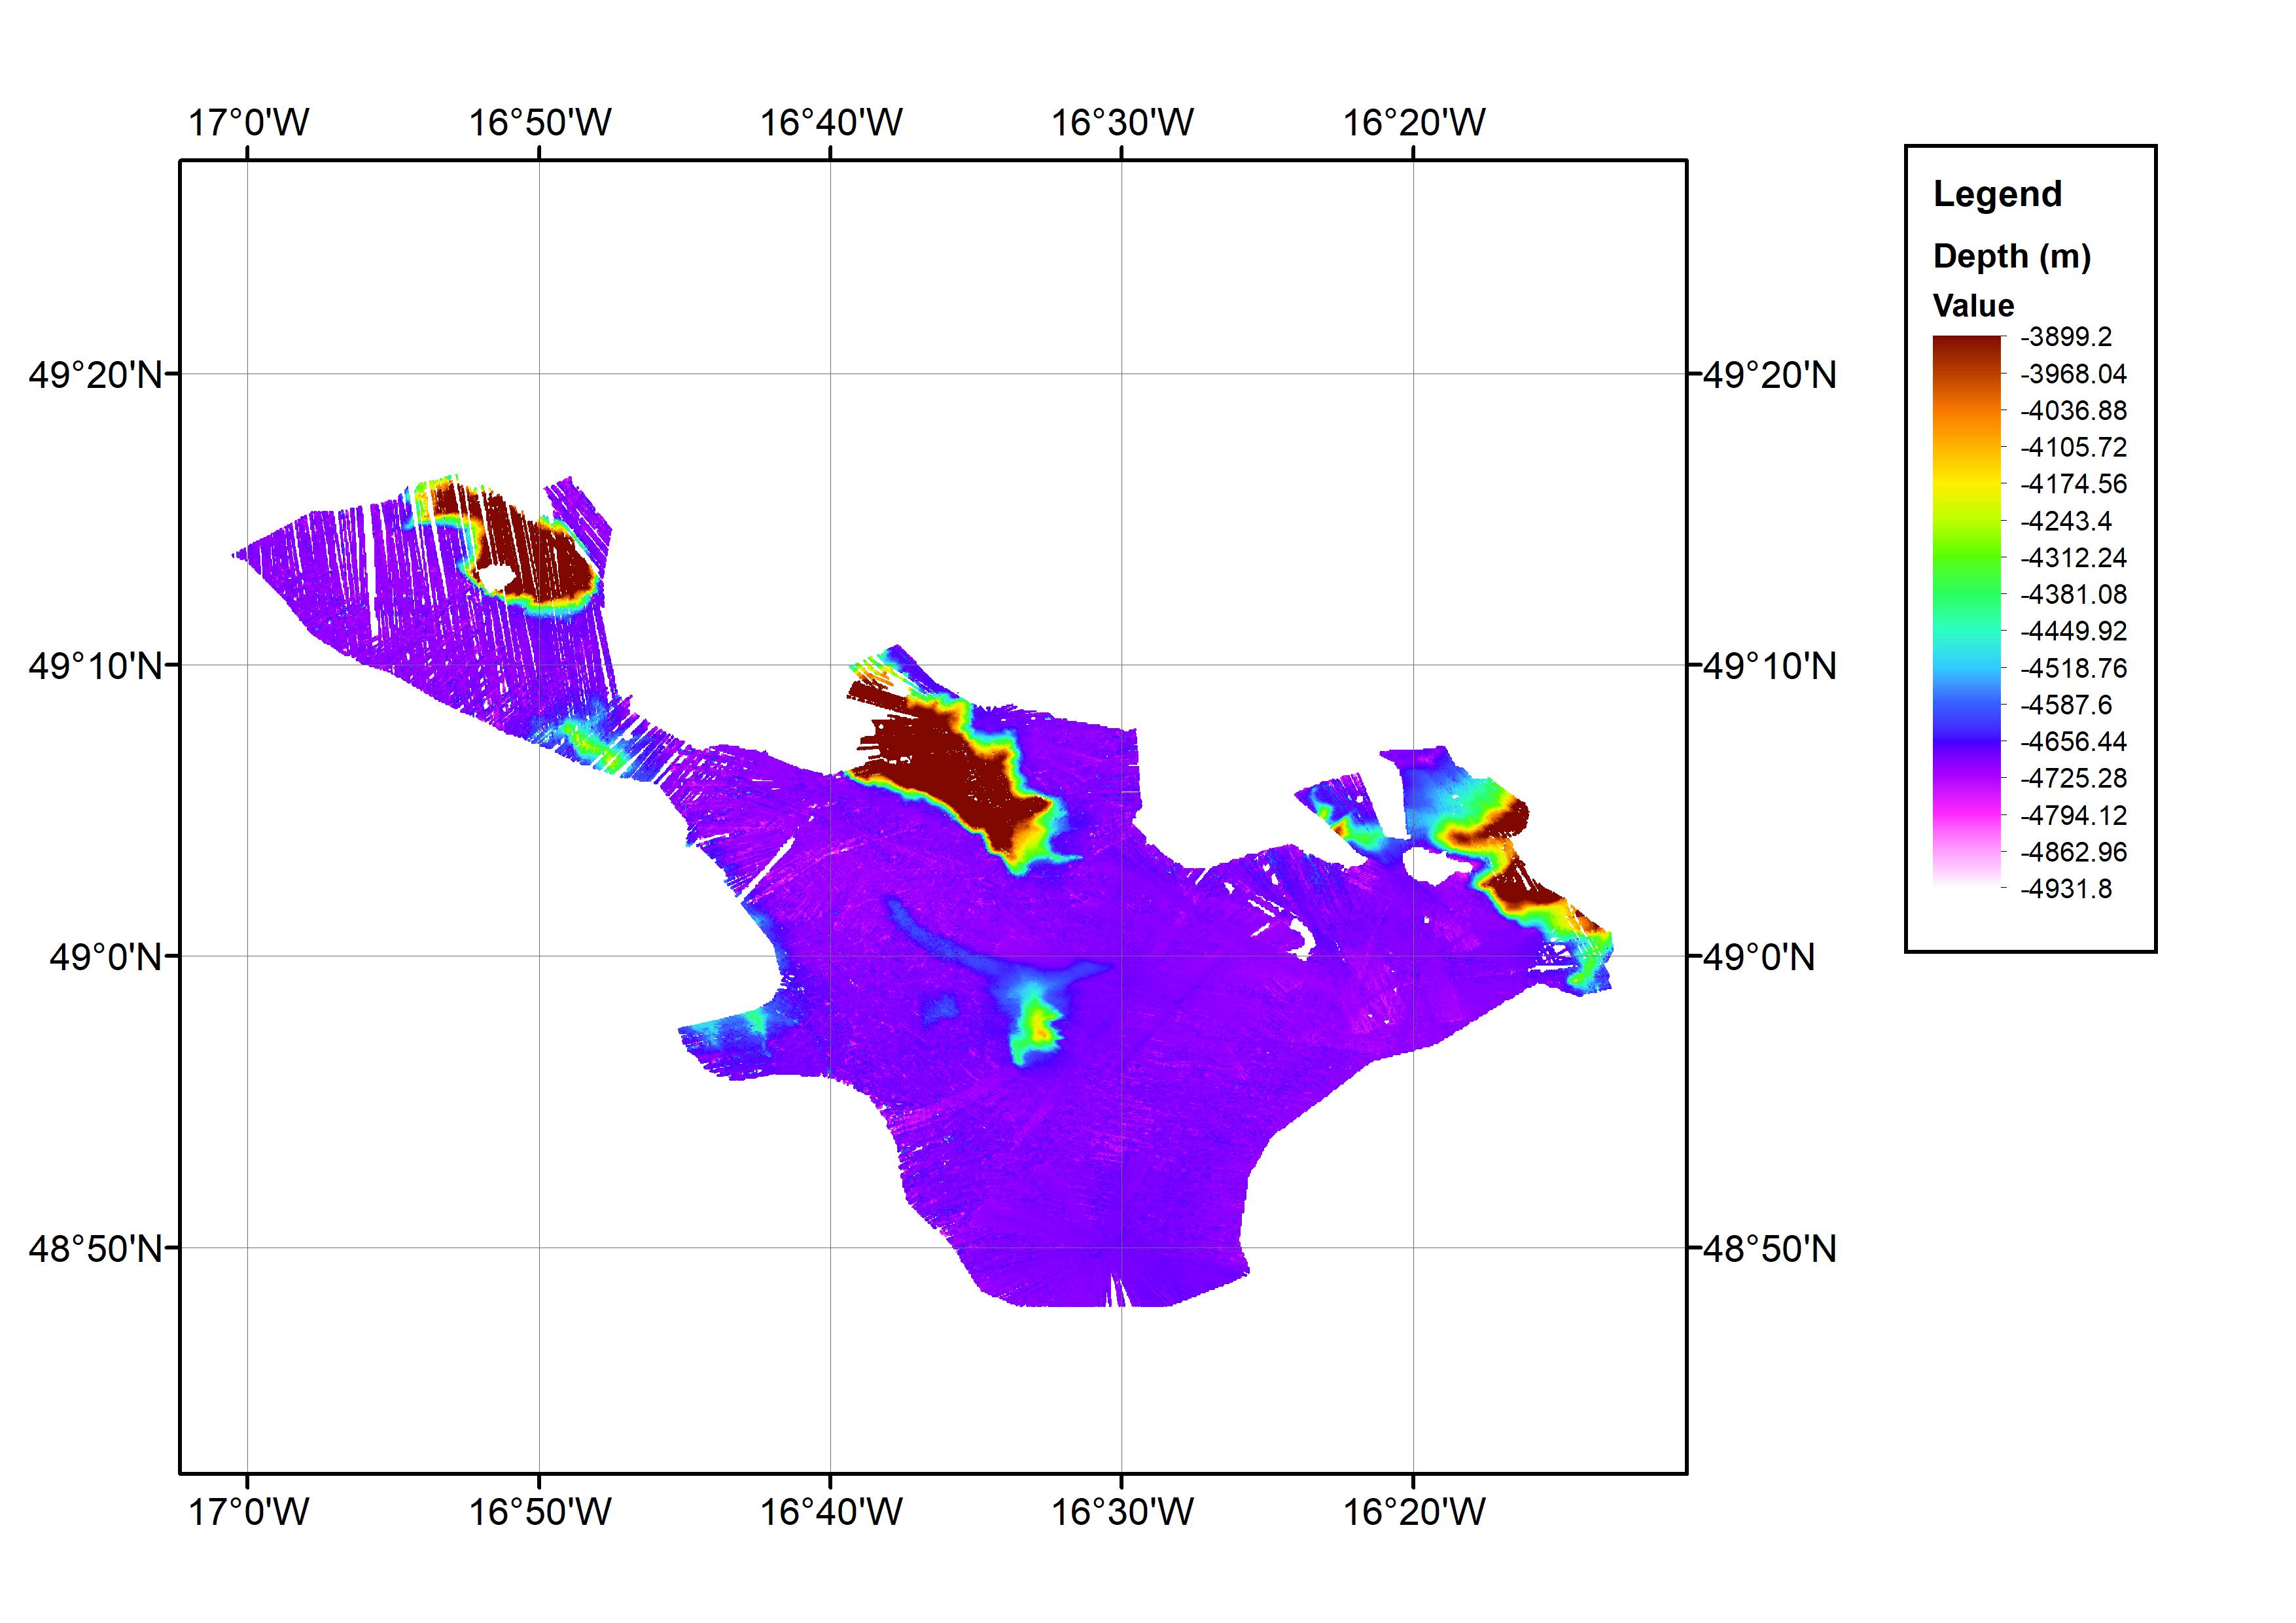
This data set consists of a bathymetric grid derived from multibeam bathymetry data from cruise JC071. The bathymetric grid was created by gridding cleaned raw multibeam data from JC071 at 1/64 arc-minute intervals. The data set covers an approximate one degree square with the minimum and maximum longitude and latitude co-ordinates: 17.016667W-16.216667W; 48.78333N-49.28333N. This is located in the Northeast Atlantic Ocean area. The data were collected from 7th-8th May 2012 using an EM120 Multibeam Echo-sounder. The cruise was part of the Porcupine Abyssal Plain (PAP): sustained ocean observation project. The bathymetry data were collected on an opportunistic basis during the cruise. The cruise was operated by the National Oceanography Centre (NOC), equipment operated by National Marine Facilities Sea Systems. The bathymetric grid was created by BODC for contributing to the EMODnet HRSM Project.
-
9496-25-DTM - Site Survey of Dogger Bank Tranche C Offshore Wind Farm Area by Gardline Geosurvey Ltd
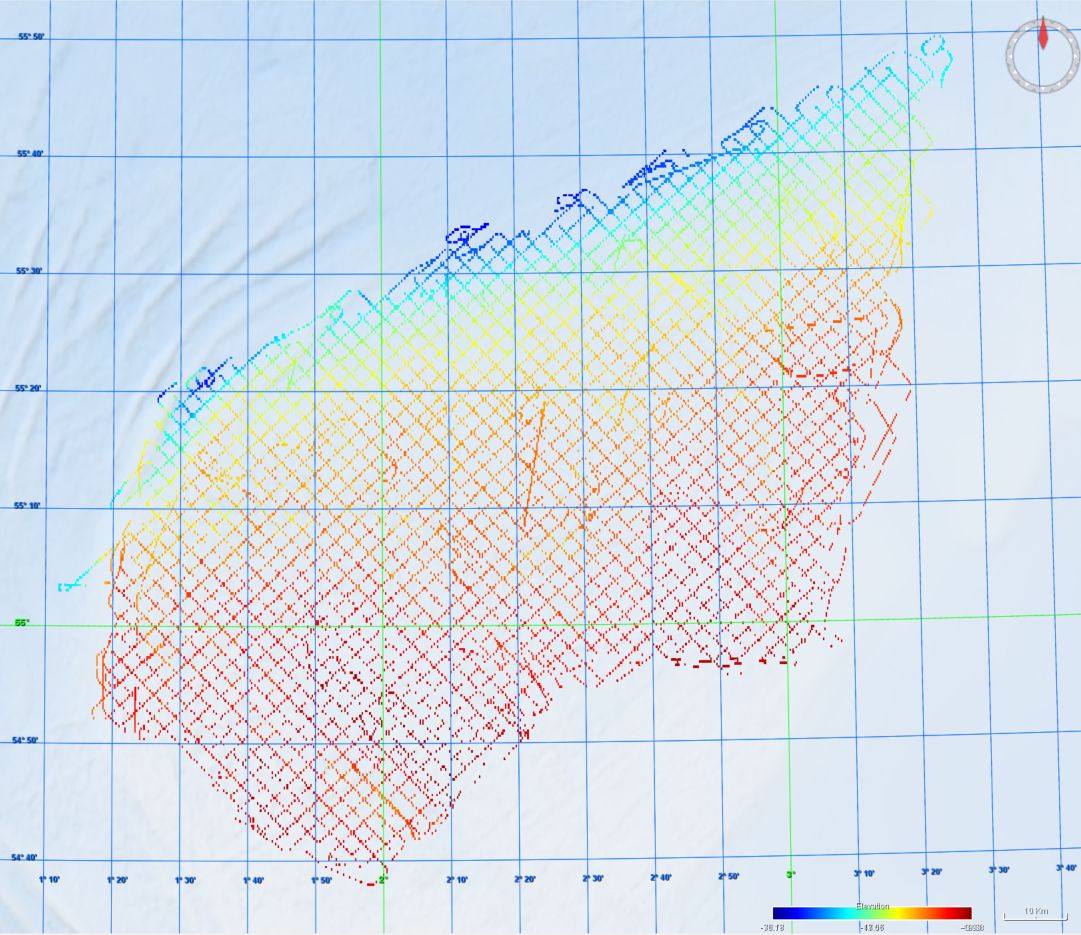
Gardline Geosurvey Limited was contracted to survey the Dogger Bank Offshore Wind Farm (OWF) Area between 04-Apr-2013 and 02-Aug-2013, comprising the Tranche C zonal surveys. The aim of the surveys was to carry out a geophysical investigation that would broadly assess the entire developable area of the zone. Seabed information was required to inform the site selection process and enable preliminary foundation design to be undertaken. The geological data acquisition programme was carried out on M.V. Sea Surveyor, which sailed from Hull and returned to Blyth, and M.V. Vigilant which sailed from, and returned to, Great Yarmouth upon completion of survey operations. The Crown Estate is the data owner and copyright holder.
-
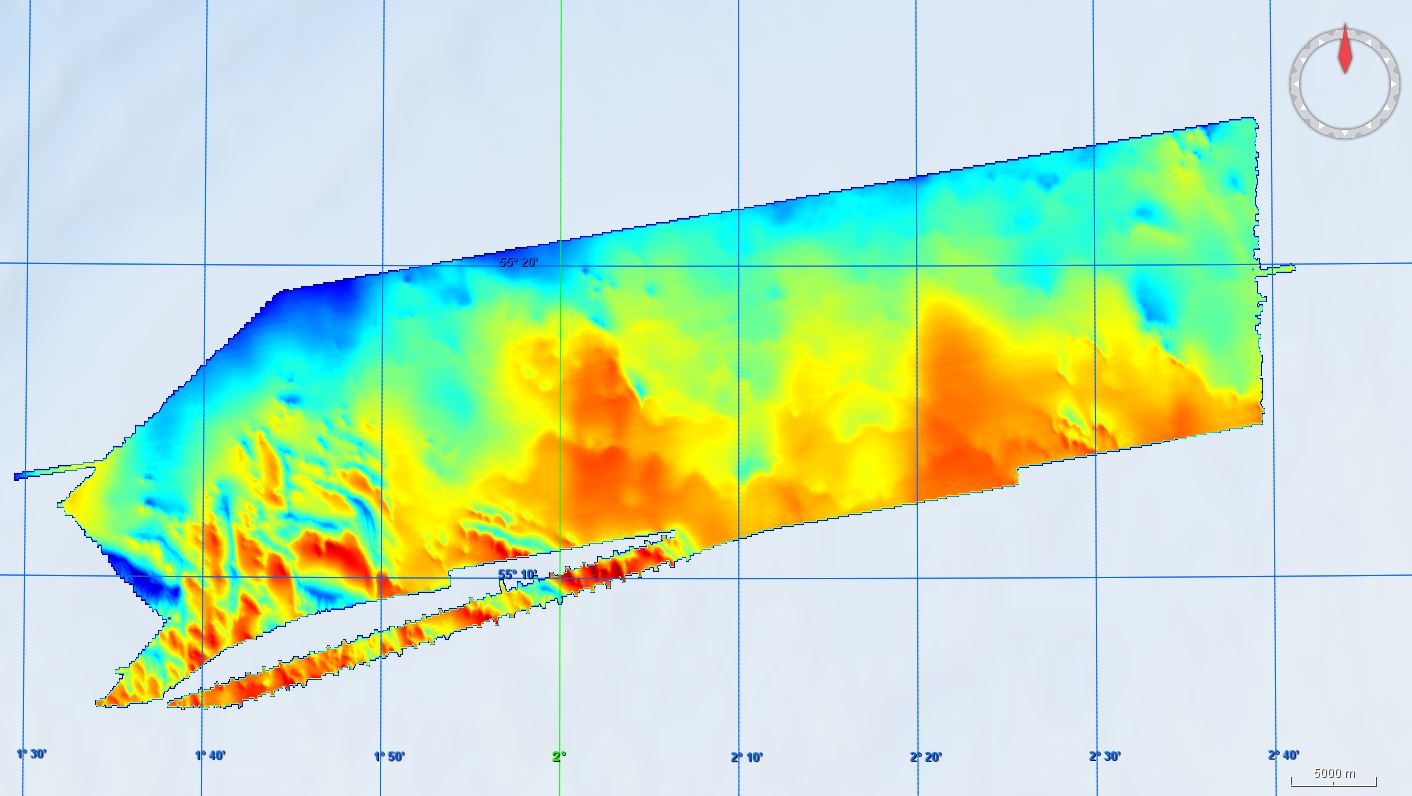
GEMS Survey Ltd. (GEMS) were contracted by Forewind Limited to undertake a bathymetric and geophysical survey of the Tranche A development area and two met mast locations (which were later revised) within the Dogger Bank Zone, in addition to a cable reconnaissance from Tranche A to the Yorkshire coastline. The primary objectives of the survey were to produce sufficiently high resolution bathymetric and geophysical data and interpretations to allow regional interpretation for planning and modelling purposes; for met mast design to commence and to provide high quality data to inform further benthic and environmental surveys. This survey was carried out between 8 July 2010 and 26 December 2010. The vertical datum for this project is LAT using predicted tides. This metadata relates to the bathymetric datasets. The surveys were undertaken onboard the MV Aquarius and MV Kommandor Jack.
-
-
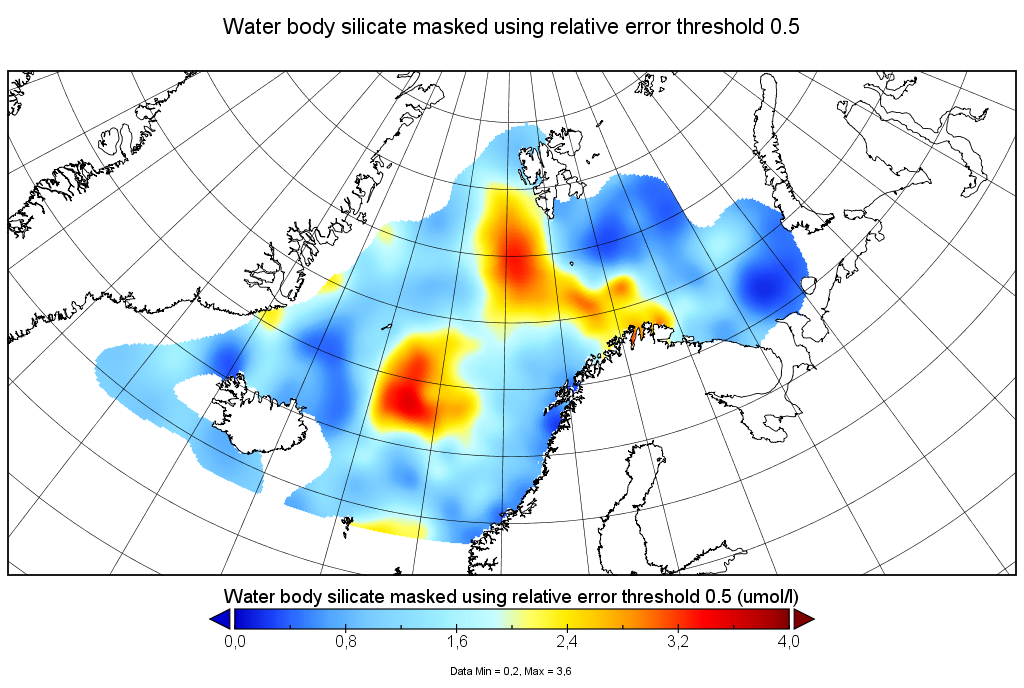
Moving 6-year analysis of Water body silicate in the Arctic Ocean, for each season in the period 1965-2017. Every year of the time dimension corresponds to the 6-year centered average for each season. Winter: December-February, Spring: March-May, Summer: June-August, Autumn: September-November. Depth range (IODE standard depths): 0, 5, 10, 20, 30, 40, 50, 75, 100, 125, 150, 200, 250, 300, 400, ..., 1500, 1750, 2000, 2500m. Units: umol/l. Description of DIVA analysis: The computation was done with the DIVAnd (Data-Interpolating Variational Analysis in n dimensions), version 2.6.6, using GEBCO 30sec topography for the spatial connectivity of water masses. The horizontal resolution of the produced DIVAnd maps grids is 0.1 degrees. Signal-to-noise ratio was fixed to 2.0, horizontal correlation length to 100 km, and vertical correlation length varying between 25 and 200 m. Logarithmic transformation is applied to the data prior to the analysis. Background field: the data mean value is subtracted from the data.
-
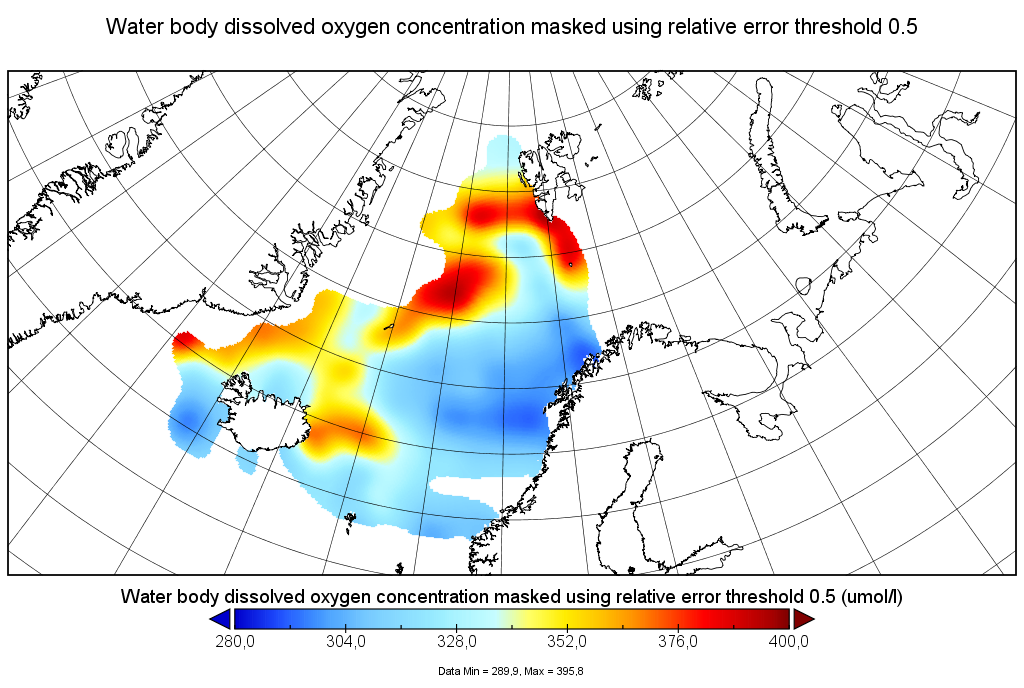
Moving 6-year analysis of Water body dissolved oxygen concentration in the Arctic Ocean, for each season in the period 1965-2017. Every year of the time dimension corresponds to the 6-year centered average for each season. Winter: December-February, Spring: March-May, Summer: June-August, Autumn: September-November. Depth range (IODE standard depths): 0, 5, 10, 20, 30, 40, 50, 75, 100, 125, 150, 200, 250, 300, 400, ..., 1500, 1750, 2000, 2500m. Units: umol/l. Description of DIVA analysis: The computation was done with the DIVAnd (Data-Interpolating Variational Analysis in n dimensions), version 2.6.6, using GEBCO 30sec topography for the spatial connectivity of water masses. The horizontal resolution of the produced DIVAnd maps grids is 0.1 degrees. Signal-to-noise ratio was fixed to 2.0, horizontal correlation length to 100 km, and vertical correlation length varying between 25 and 200 m. Logarithmic transformation is applied to the data prior to the analysis. Background field: the data mean value is subtracted from the data.
-

The "EMODnet Digital Bathymetry (DTM)- 2018" is a multilayer bathymetric product for Europe’s sea basins covering: • the Greater North Sea, including the Kattegat and stretches of water such as Fair Isle, Cromarty, Forth, Forties,Dover, Wight, and Portland • the English Channel and Celtic Seas • Western Mediterranean, the Ionian Sea and the Central Mediterranean Sea • Iberian Coast and Bay of Biscay (Atlantic Ocean) • Adriatic Sea (Mediterranean) • Aegean - Levantine Sea (Mediterranean). • Madeira and Azores (Macaronesia) • Baltic Sea • Black Sea • Norwegian and Icelandic Seas • Canary Islands (Macaronesia) • Arctic region and Barentz Sea The DTM is based upon more than 9400 bathymetric survey data sets and Composite DTMs that have been gathered from 49 data providers from 24 countries riparian to European seas. Also Satellite Derived Bathymetry data products have been included derived from Landsat 8 satellite images. The source reference layer in the portal viewing service gives metadata of the data sets used with their data providers; the metadata also acknowledges the data originators. The incorporated survey data sets itself can be discovered and requested for access through the Common Data Index (CDI) data discovery and access service that in September 2018 contained > 27.000 survey data sets from European data providers for global waters. The Composite DTMs can be discovered through the Sextant Catalogue service. Both discovery services make use of SeaDataNet standards and services and have been integrated in the EMODnet Bathymetry web portal (http://www.emodnet-bathymetry.eu). In addition, the Bathymetry Viewing and Download service of the EMODnet bathymetry portal gives users wide functionality for viewing and downloading the EMODnet digital bathymetry such as: • water depth (refering to the Lowest Astronomical Tide Datum - LAT) in gridded form on a DTM grid of 1/16 * 1/16 arc minute of longitude and latitude (ca 115 * 115 meters) • option to view depth parameters of individual DTM cells and references to source data • option to download DTM in 64 tiles in different formats: EMO, EMO (without GEBCO data), ESRI ASCII, ESRI ASCII Mean Sea Level, XYZ, NetCDF (CF), RGB GeoTiff and SD • option to visualize the DTM in 3D in the browser without plug-in • layer with a number of high resolution DTMs for coastal regions • layer with wrecks from the UKHO Wrecks database. The EMODnet DTM is also available by means of OGC web services (WMS, WFS, WCS, WMTS), which are specified at the EMODnet Bathymetry portal. The original datasets themselves are not distributed but described in the metadata services, giving clear information about the background survey data used for the DTM, their access restrictions, originators and distributors and facilitating requests by users to originator.
-
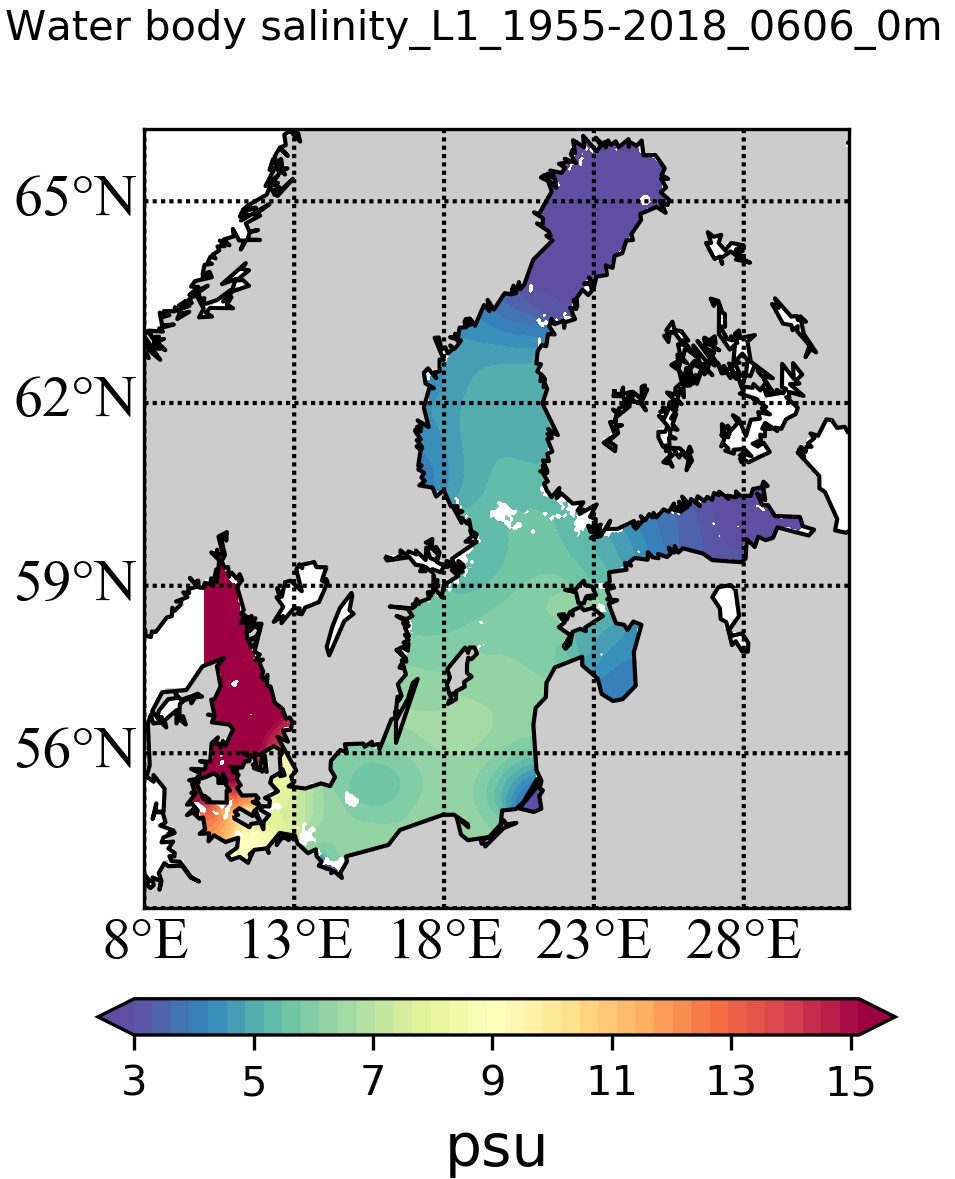
The SDC_BAL_CLIM_TS_V2 product contains temperature and salinity climatologies for the Baltic Sea, including seasonal and monthly fields for the period 1955-2018 and seasonal and monthly fields for 6 decades starting from 1955 to 2018. The climatological fields were computed from a merged Baltic Sea data set that combines data extracted from two major sources: 1) SeaDataNet infrastructure and 2) Coriolis Ocean Dataset for Reanalysis. The computation was done with the DIVAnd (Data-Interpolating Variational Analysis in n dimensions), version 2.6.3.
-
The "EMODnet Digital Bathymetry (DTM)- 2020" is a multilayer bathymetric product for Europe’s sea basins covering: • the Greater North Sea, including the Kattegat and stretches of water such as Fair Isle, Cromarty, Forth, Forties,Dover, Wight, and Portland • the English Channel and Celtic Seas • Western Mediterranean, the Ionian Sea and the Central Mediterranean Sea • Iberian Coast and Bay of Biscay (Atlantic Ocean) • Adriatic Sea (Mediterranean) • Aegean - Levantine Sea (Mediterranean). • Madeira and Azores (Macaronesia) • Baltic Sea • Black Sea • Norwegian and Icelandic Seas • Canary Islands (Macaronesia) • Arctic region and Barentz Sea The DTM is based upon more than 16360 bathymetric survey data sets and Composite DTMs that have been gathered from 49 data providers from 24 countries riparian to European seas. Also Satellite Derived Bathymetry data products have been included derived from Landsat 8 and Sentinel satellite images. Areas not covered by observations are completed by integrating GEBCO 2020 and IBCAO V4. The source reference layer in the portal viewing service gives metadata of the data sets used with their data providers; the metadata also acknowledges the data originators. The incorporated survey data sets itself can be discovered and requested for access through the Common Data Index (CDI) data discovery and access service that in December 2020 contained > 30.000 survey data sets from European data providers for global waters. The Composite DTMs can be discovered through the Sextant Catalogue service. Both discovery services make use of SeaDataNet standards and services and have been integrated in the EMODnet Bathymetry web portal (http://www.emodnet-bathymetry.eu). In addition, the Bathymetry Viewing and Download service of the EMODnet bathymetry portal gives users wide functionality for viewing and downloading the EMODnet digital bathymetry such as: • water depth (refering to the Lowest Astronomical Tide Datum - LAT) in gridded form on a DTM grid of 1/16 * 1/16 arc minute of longitude and latitude (ca 115 * 115 meters). • option to view depth parameters of individual DTM cells and references to source data • option to download DTM in 64 tiles in different formats: ESRI ASCII, XYZ, EMODnet CSV, NetCDF (CF), GeoTiff and SD • option to visualize the DTM in 3D in the browser without plug-in • layer with a number of high resolution DTMs for coastal regions • layer with wrecks from the UKHO Wrecks database. The EMODnet DTM is also available by means of OGC web services (WMS, WFS, WCS, WMTS), which are specified at the EMODnet Bathymetry portal. The original datasets themselves are not distributed but described in the metadata services, giving clear information about the background survey data used for the DTM, their access restrictions, originators and distributors and facilitating requests by users to originator.
-
Moving 6-year analysis and visualization of Water body dissolved oxygen concentration in the North Sea, four seasons: winter (dec-feb), spring (mar-may), summer (jun-aug), autumn (sep-nov). Data Sources: observational data from SeaDataNet/EMODnet Chemistry Data Network. Description of DIVA analysis: Geostatistical data analysis by DIVAnd (Data-Interpolating Variational Analysis) tool, version 2.7.2. results were subjected to the minfield option in DIVAnd to avoid negative/underestimated values in the interpolated results; error threshold masks L1 (0.3) and L2 (0.5) are included as well as the unmasked field. The depth dimension allows visualizing the gridded field at various depths.