 Metadata catalogue
Baltic Sea Research Institute Warnemuende (IOW), Marine Geology
Type of resources
Topics
INSPIRE themes
Keywords
Contact for the resource
Provided by
Years
Formats
Resolution
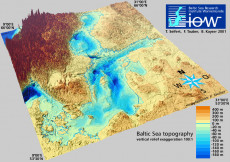
-
The data sets presented here provide a digitised topography of the Baltic Sea. Land heights and water depths have been calculated for two regular spherical grids from available data. Data set "iowtopo2" covers the whole Baltic Sea from 9° to 31° East and from 53°30’ to 66° North by (660 x 750) grid cells, see Fig. 1. The resolution is 2 minutes with respect to longitude, and 1 minute to latitude. This is approximately 1 nautical mile, or 2 km resp. The region of the Belt Sea from 9° to 15°10’ East and from 53°30’ to 56°30’ North, see Fig 2, is comprised within data set "iowtopo1" with a twofold higher resolution (1 minute in longitude and 0.5 minutes in latitude corresponding to approx. 1 km). The data specify a representative average of the water depth or the land height of each grid cell, counted by negative and positive values in meters. Some statistical parameters allow a rough estimate of the reliability of the data. (Please be aware that data are rather uncertain in regions where strong gradients of the bottom relief occur, esp. the northern parts of the Baltic. There is an urgent need of further bathymetry data to become available for the Baltic beyond 59° North.) Since a common average of land heights and water depths lead to rather unsatisfying results with respect to the gridded shoreline, a landmask is proposed in both data sets. The landmasks were derived from the global high resolution shorelines GSHHS and RANGS, and used to get a "naturally looking" composite topography (z_topo see below). Citation: T. Seifert, F. Tauber, B. Kayser: 2001: "A high resolution spherical grid topography of the Baltic Sea – 2nd edition", Baltic Sea Science Congress, Stockholm 25-29. November 2001, Poster #147,