 Metadata catalogue
Baltic Sea Research Institute Warnemuende (IOW)
Type of resources
Available actions
Topics
INSPIRE themes
Keywords
Contact for the resource
Provided by
Years
Formats
Representation types
Resolution
-

SeaDataNet Temperature and Salinity historical data collection for the North Arctic Ocean, including revised quality flags after quality control with ODV. For data access please register at http://www.marine-id.org The dataset format is ODV binary collections. You can read, analyse and export from the ODV application provided by Alfred Wegener institute at http://odv.awi.de/
-
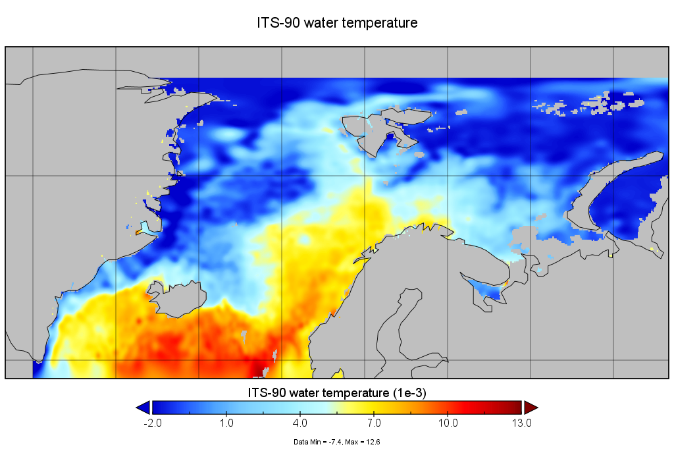
The SeaDataCloud Temperature and Salinity Climatologies have been processed from the historical Data Collection of the Arctic Ocean (from 56°N to 83°N and from 45°W to 70°E) including temperature and salinity in situ data of the water column for the period 1955 – 2019. The analysis was run in six decadal periods (1955-1964/1965-1974/1975-1984/1985-1994/1995-2004/2005-2014). A subset of the World Ocean Database 2018 (WOD18, https://www.nodc.noaa.gov/OC5/WOD/pr_wod.html) dataset has been integrated as external data-source to improve data availability for analysis.
-
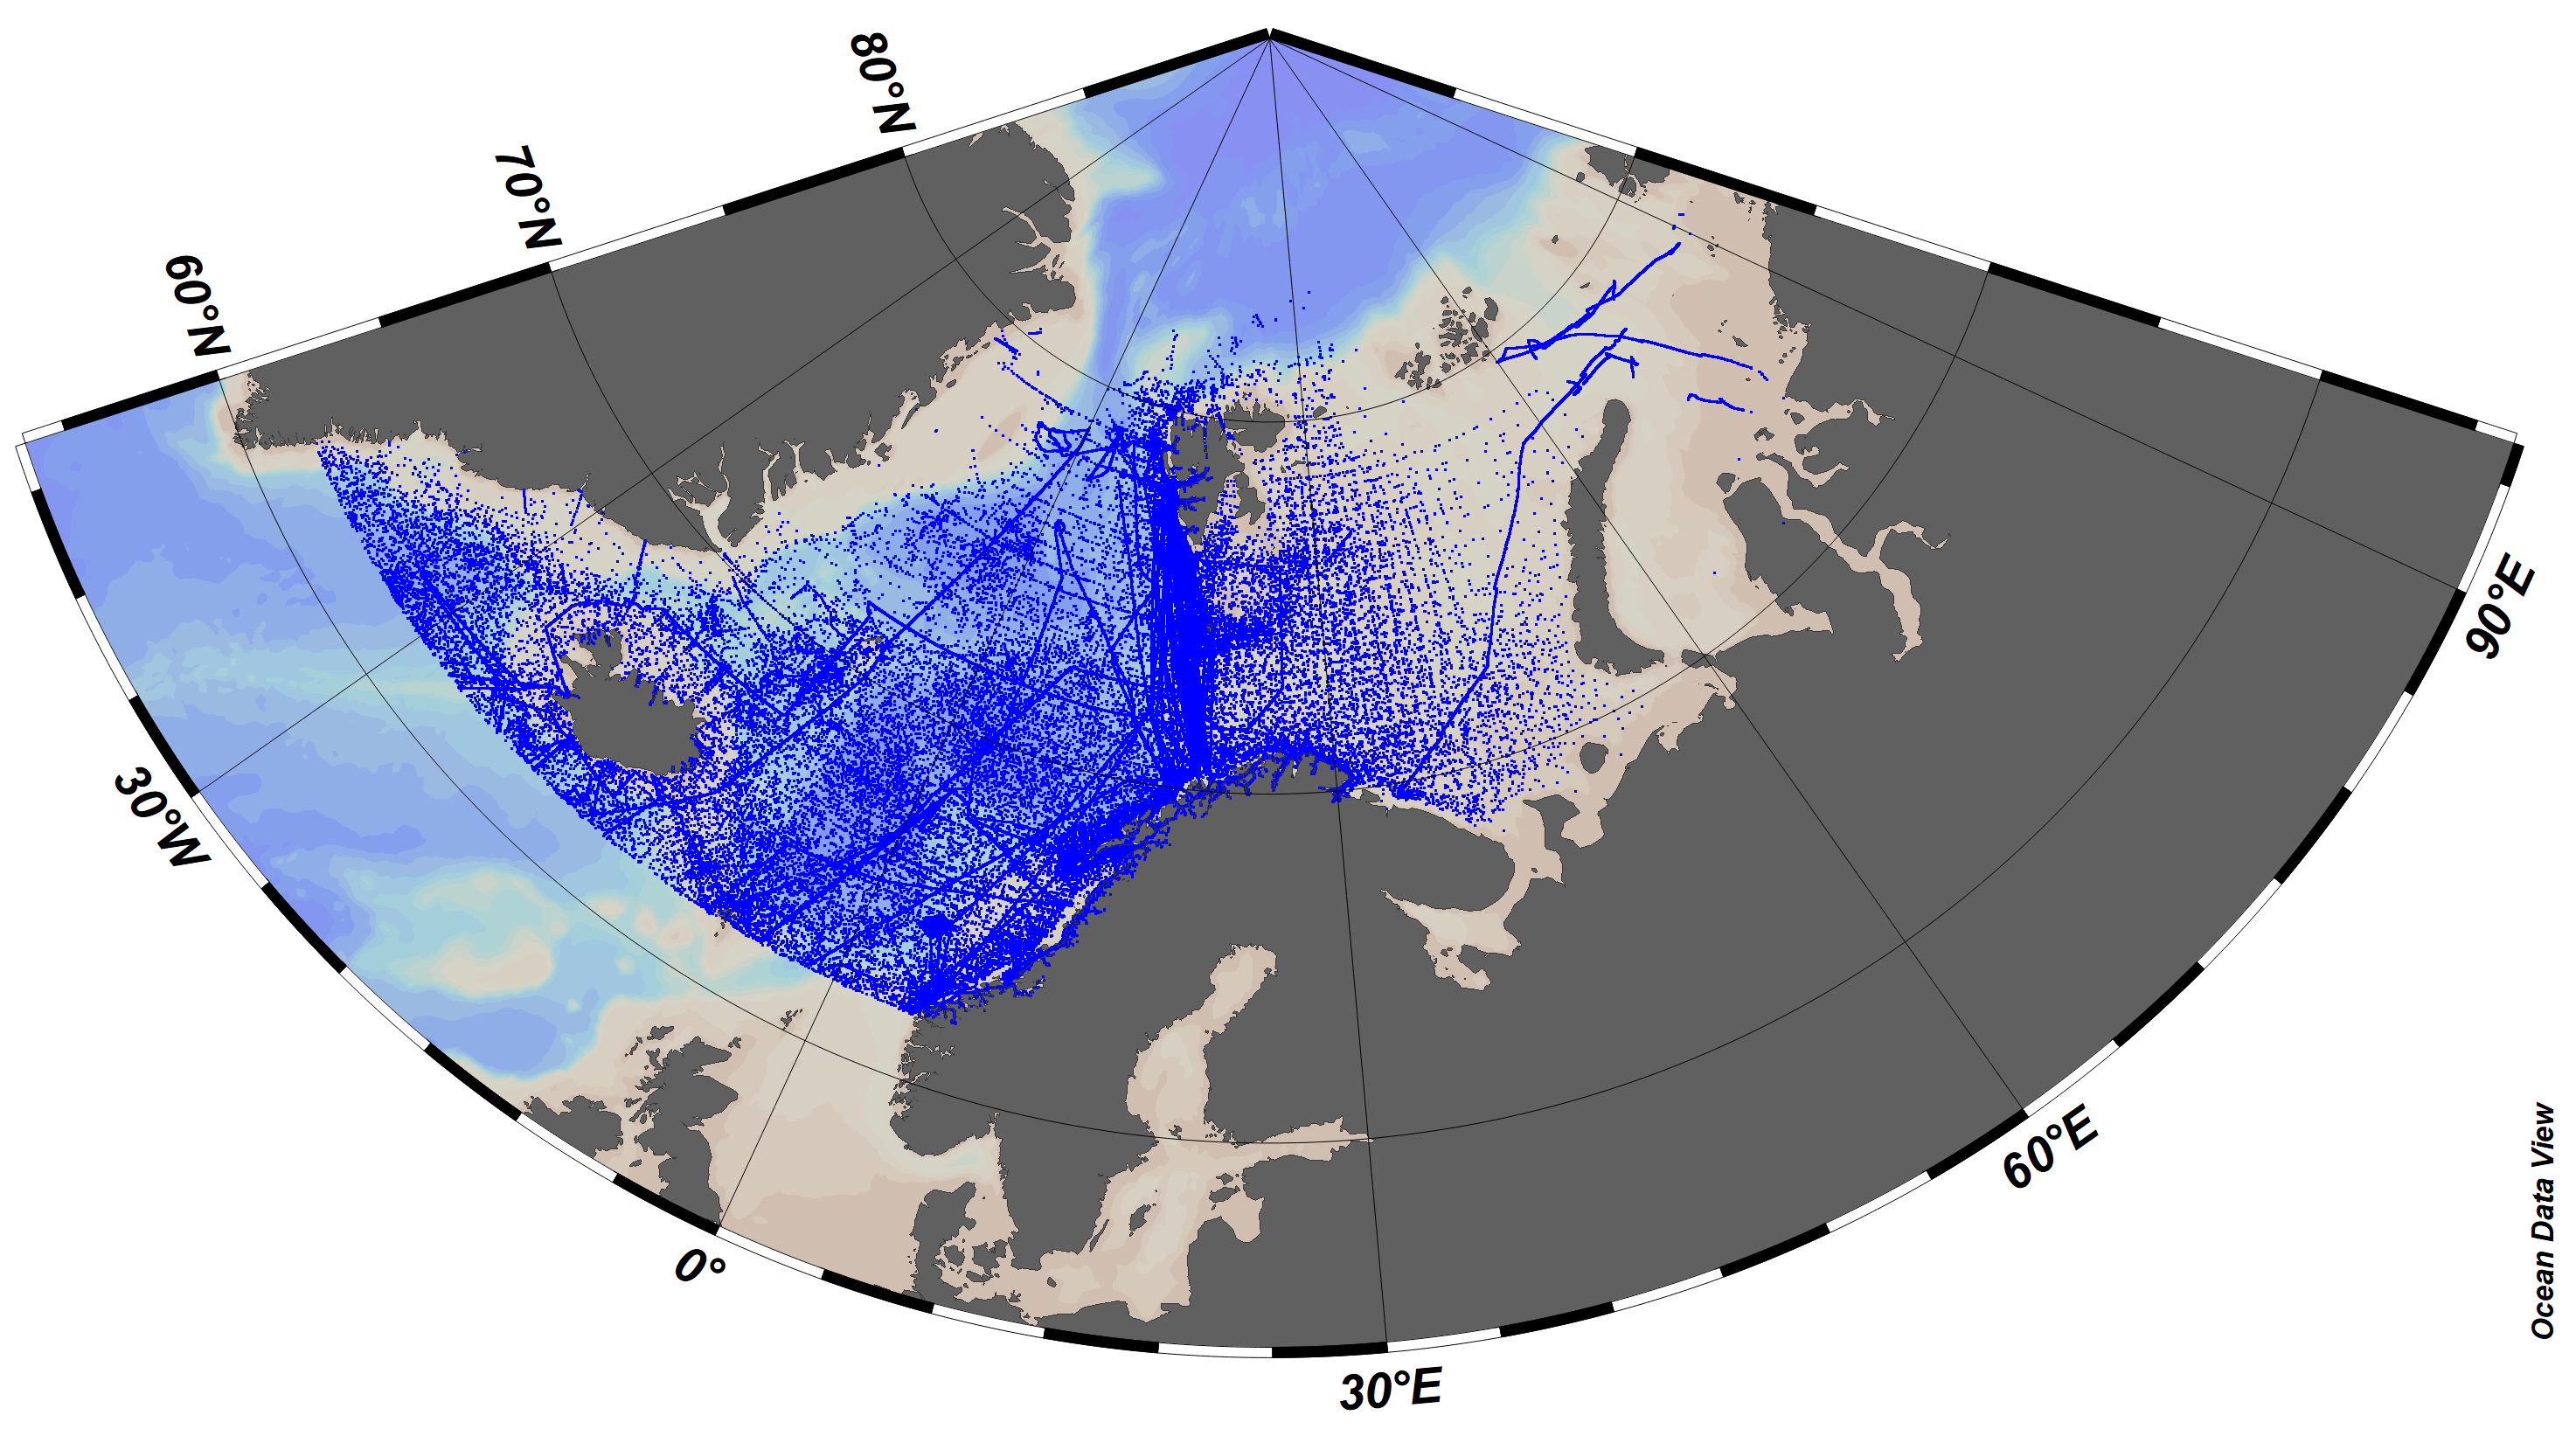
SeaDataCloud Temperature and Salinity historical data collection for the Arctic Ocean, including revised quality flags after quality control with ODV. The dataset format is ODV binary collections. You can read, analyse and export from the ODV application provided by Alfred Wegener institute at http://odv.awi.de/. For data access please register at http://www.marine-id.org/.
-

Moving 6-year analysis of Water body ammonium in the Baltic Sea. Four seasons (March-May, June-August, September-November, December-February). Every year of the time dimension corresponds to the 6-year centred average. Periods span between 1980-1985 and 2011-2016. Analyses for depths (m) (HELCOM standard depths): 0, 5, 10, 15, 20, 30, 40, 50, 60, 70, 80, 90, 100, 125, 150, 175, 200, 225, 250, 275, 300. Data Sources: observational data from SeaDataNet/EMODnet Chemistry Data Network. Description of DIVA analysis: Geostatistical data analysis by DIVA (Data-Interpolating Variational Analysis) tool. GEBCO_08 Grid (30 arc-seconds) topography is used for the contouring preparation. Files contain analysed fields, error fields and combined field with the deepest value for each grid point selected. Also pre-masked fields using relative error threshold 0.3 and 0.5 are included. In the analyses the Correlation length and Signal to noise ratio were fixed to 0.7 and 1.0 respectively. Background fields were created using all data (1980-2016) for the given season. Log transformation (option 11) was used in the analyses. No detrending, advection constraints or weighting are applied. Unit is umol/l. The entire set of related maps can be found in the viewing service: http://ec.oceanbrowser.net/emodnet/ .
-
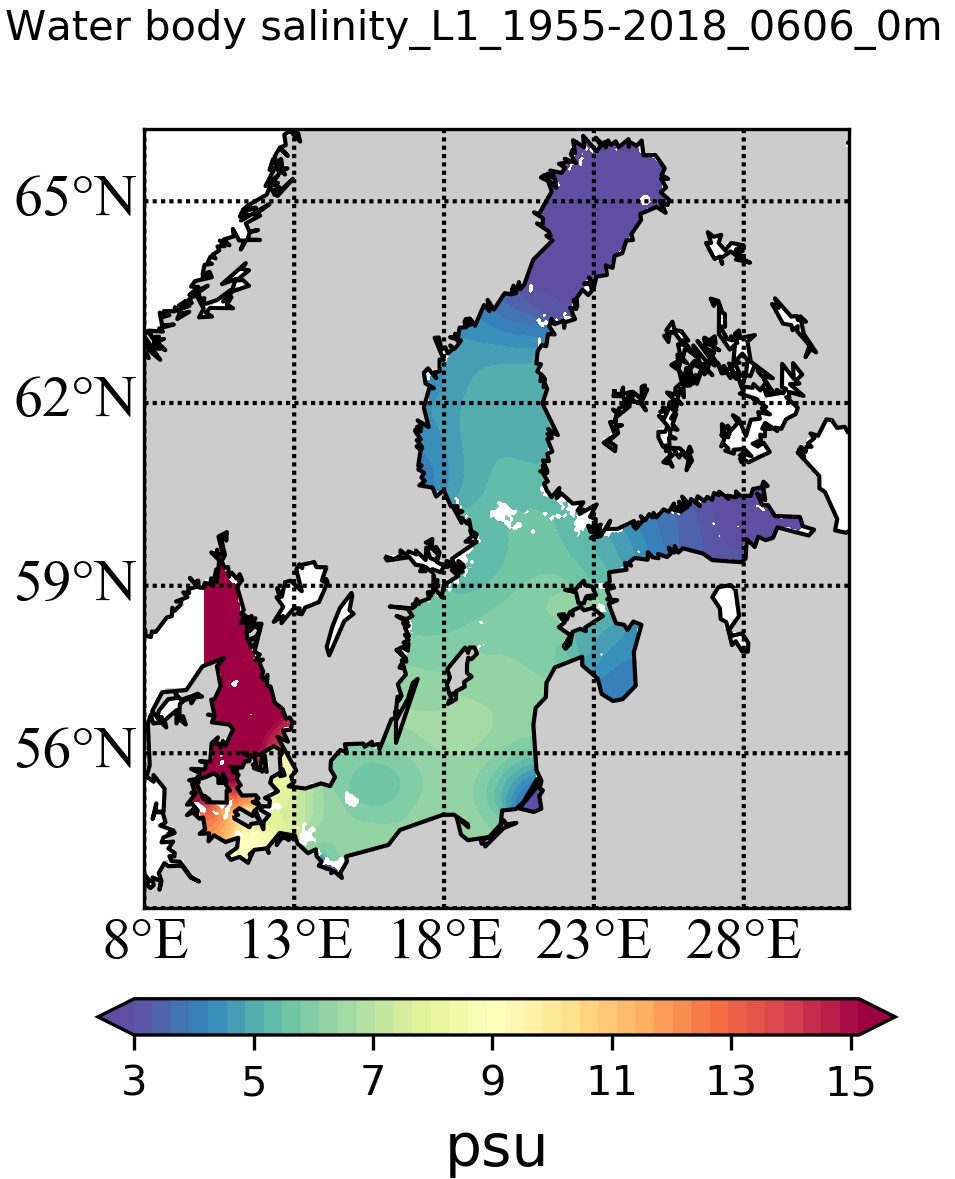
The SDC_BAL_CLIM_TS_V2 product contains temperature and salinity climatologies for the Baltic Sea, including seasonal and monthly fields for the period 1955-2018 and seasonal and monthly fields for 6 decades starting from 1955 to 2018. The climatological fields were computed from a merged Baltic Sea data set that combines data extracted from two major sources: 1) SeaDataNet infrastructure and 2) Coriolis Ocean Dataset for Reanalysis. The computation was done with the DIVAnd (Data-Interpolating Variational Analysis in n dimensions), version 2.6.3.
-
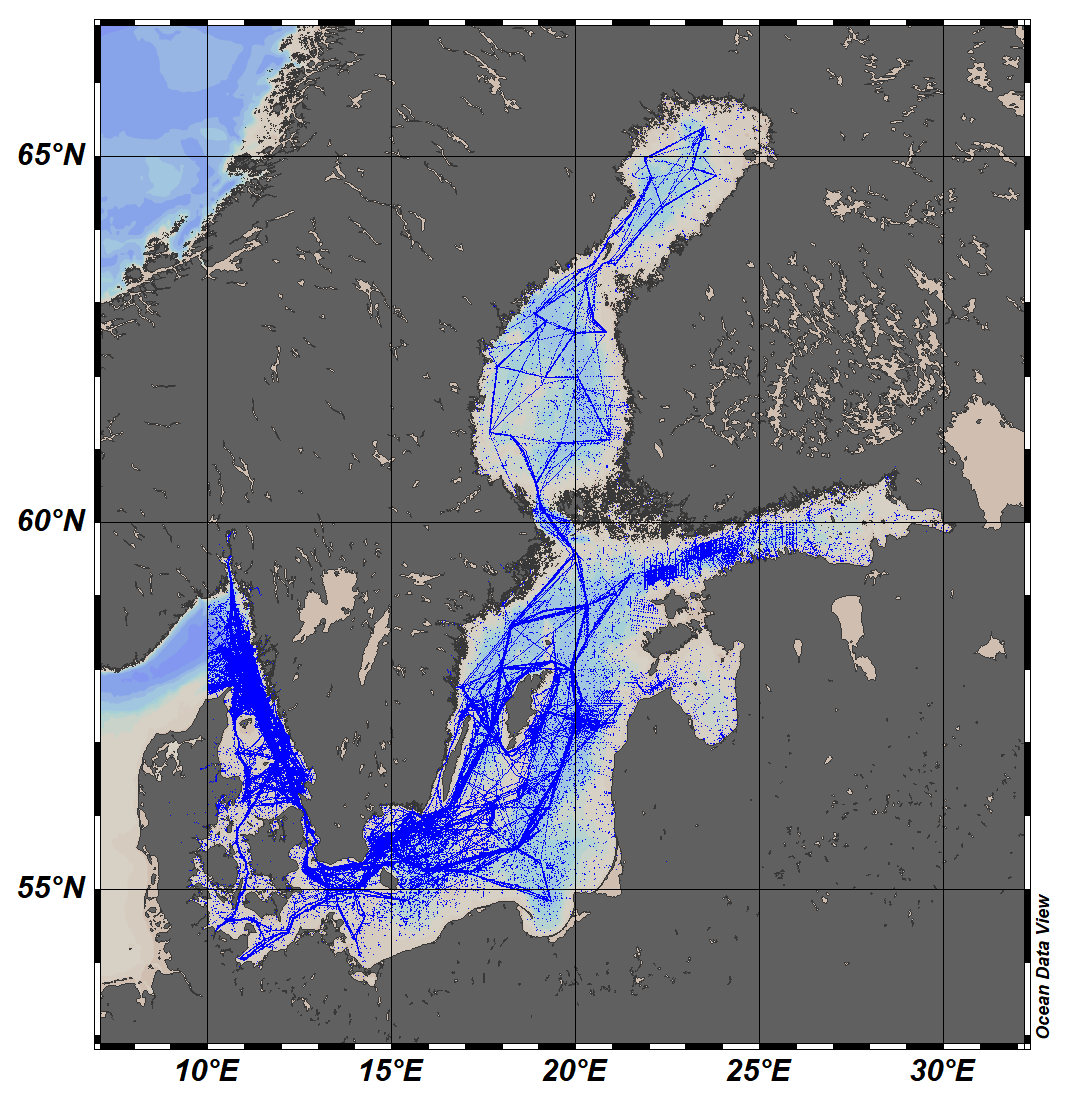
The SeaDataCloud Temperature and Salinity historical data collection for the Baltic Sea V2 includes open access in situ data on temperature and salinity of water column. The data were retrieved from the SeaDataNet infrastructure during summer 2019. Data have been quality controlled according to the SeaDataNet2 project QC procedures in conjunction with the visual expert check using the ODV software. The final number of stations in the collection is 481695, containing around 14.4 million values for both temperature and salinity. The dataset format is ODV binary collection which you can read, analyse and export from with the ODV application provided by the Alfred Wegener institute at http://odv.awi.de/. For data access please register at http://www.marine-id.org/.
-
The SDC_BAL_TS_statistics_DP1 contains temperature and salinity means and standard deviation at different depths in basins in the Baltic Sea for every month. Based on the SeaDataCloud historical dataset SDC_BAL_DATA_TS_V2 covering the period 1900 – 2019 and merged with the Coriolis ocean dataset for reanalysis (CORA) dataset (https://www.seanoe.org/data/00351/46219/).
-

Combined product of Water body chlorophyll a based on DIVA 4D 10-year analysis on five regions : Northeast Atlantic Ocean, North Sea, Baltic Sea, Black Sea, Mediterranean Sea. The boundaries and overlapping zones between these five regions were filtered to avoid any unrealistic spatial discontinuities. This combined Water body chlorophyll a product is masked using the relative error threshold 0.5. Units: mg/m^3. Created by 'University of Liege, GeoHydrodynamics and Environment Research (ULg-GHER)'.
-

Combined product of Water body dissolved oxygen concentration based on DIVA 4D 10-year analysis on five regions : Northeast Atlantic Ocean, North Sea, Baltic Sea, Black Sea, Mediterranean Sea. The boundaries and overlapping zones between these five regions were filtered to avoid any unrealistic spatial discontinuities. This combined water body dissolved oxygen concentration product is masked using the relative error threshold 0.5. Units: umol/l