 Metadata catalogue
Alfred-Wegener-Institute for Polar- and Marine Research
Type of resources
Available actions
Topics
INSPIRE themes
Keywords
Contact for the resource
Provided by
Years
Formats
Representation types
Scale
Resolution
-

Bathymetry data was acquired during R/V MARIA S. MERIAN cruise MSM44 in the northeastern Baffin Bay between 30.06.2015 and 30.07.2015. The cruise carried out multidisciplinary research in order to investigate the deglaciation history of the Greenland Ice Sheet (GIS). To research the involved ocean, cryosphere and climate processes and feedbacks and to address the complex spatial and temporal distribution patterns of the marine GIS terminations in the northeast Baffin Bay, RV MARIA S. MERIAN visited sites in the Davis Strait, the Uumannaq Trough, and the Melville Bay during expedition MSM44. The objectives were to systematically search for and map glacigenic seafloor features providing information on the maximum extend and retreat histories of ice sheets since the last glacial maximum and during the Holocene. Extensive mapping was conducted due to the fact, that several huge parts of Greenland’s coast are only insufficiently mapped or completely uncharted and thus are barely reliable in concern of navigation and interpretation towards glacigenic features of the last ice ages. CI Citation: Paul Wintersteller (seafloor-imaging@marum.de) as responsible party for bathymetry raw data ingest and approval.
-

Units: umol/l. Method: spatial interpolation produced with DIVA (Data-Interpolating Variational Analysis). URL: http://modb.oce.ulg.ac.be/DIVA. Comment: Every year of the time dimension corresponds to a 10-year centred average for each season : - winter season (December-February), - spring (March-May), - summer (June-August), - autumn (September-November). Diva settings: Snr=1.0, CL=0.7
-

SeaDataNet Temperature and Salinity historical data collection for the North Arctic Ocean, including revised quality flags after quality control with ODV. For data access please register at http://www.marine-id.org The dataset format is ODV binary collections. You can read, analyse and export from the ODV application provided by Alfred Wegener institute at http://odv.awi.de/
-
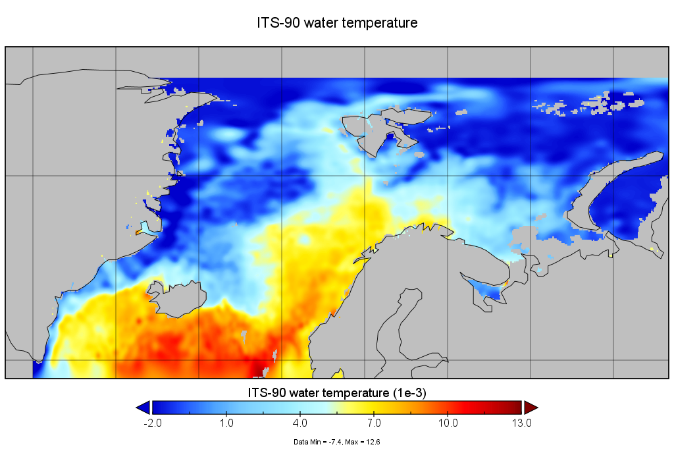
The SeaDataCloud Temperature and Salinity Climatologies have been processed from the historical Data Collection of the Arctic Ocean (from 56°N to 83°N and from 45°W to 70°E) including temperature and salinity in situ data of the water column for the period 1955 – 2019. The analysis was run in six decadal periods (1955-1964/1965-1974/1975-1984/1985-1994/1995-2004/2005-2014). A subset of the World Ocean Database 2018 (WOD18, https://www.nodc.noaa.gov/OC5/WOD/pr_wod.html) dataset has been integrated as external data-source to improve data availability for analysis.
-

This gridded product visualizes 1960 - 2014 water body ammonium concentration (umol/l) in the North Sea domain, for each season (winter: December – February; spring: March – May; summer: June – August; autumn: September – November). It is produced as a Diva 4D analysis, version 4.6.9: a reference field of all seasonal data between 1960-2014 was used; results were logit transformed to avoid negative/underestimated values in the interpolated results; error threshold masks L1 (0.3) and L2 (0.5) are included as well as the unmasked field. Every step of the time dimension corresponds to a 10-year moving average for each season. The depth dimension allows visualizing the gridded field at various depths.
-
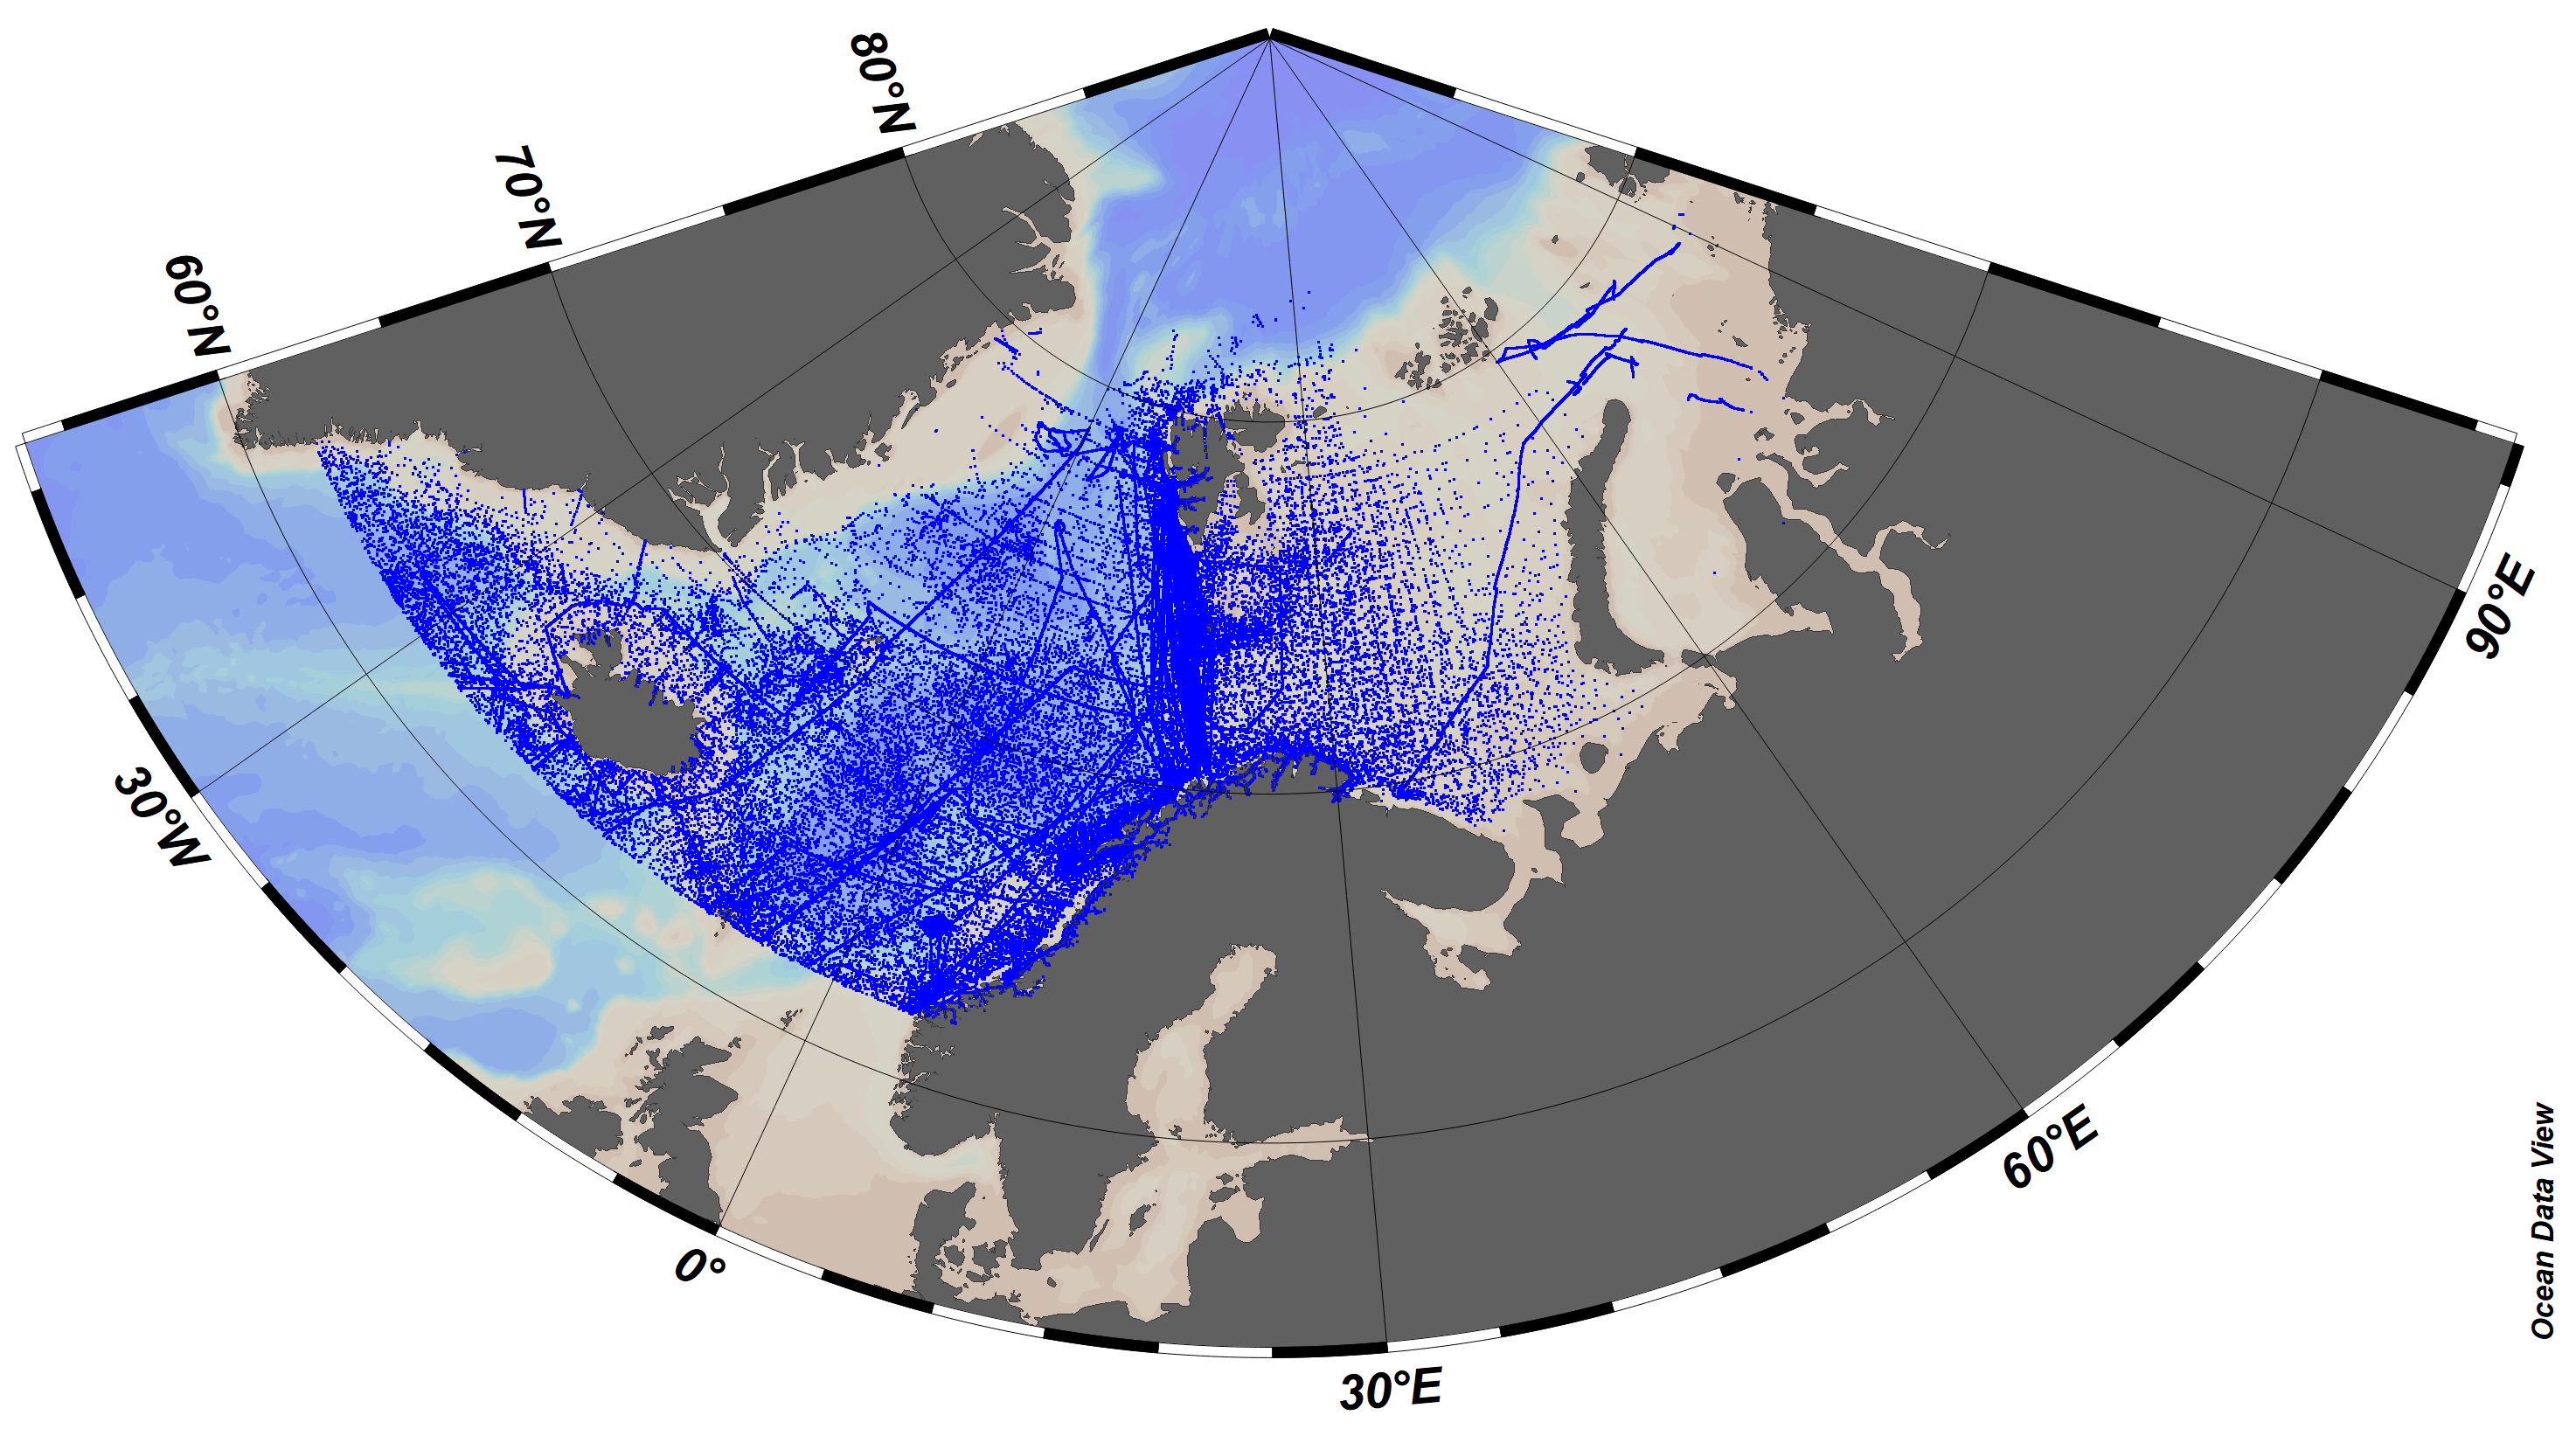
SeaDataCloud Temperature and Salinity historical data collection for the Arctic Ocean, including revised quality flags after quality control with ODV. The dataset format is ODV binary collections. You can read, analyse and export from the ODV application provided by Alfred Wegener institute at http://odv.awi.de/. For data access please register at http://www.marine-id.org/.
-

Units: umol/l. Method: spatial interpolation produced with DIVA (Data-Interpolating Variational Analysis). URL: http://modb.oce.ulg.ac.be/DIVA. Comment: Every year of the time dimension corresponds to a 10-year centred average for each season : - winter season (December-February), - spring (March-May), - summer (June-August), - autumn (September-November). Diva settings: Snr=1.0, CL=0.7.
-

This gridded product visualizes 1960 - 2014 water body nitrate concentration (umol/l) in the North Sea domain, for each season (winter: December – February; spring: March – May; summer: June – August; autumn: September – November). It is produced as a Diva 4D analysis, version 4.6.9: a reference field of all seasonal data between 1960-2014 was used; results were logit transformed to avoid negative/underestimated values in the interpolated results; error threshold masks L1 (0.3) and L2 (0.5) are included as well as the unmasked field. Every step of the time dimension corresponds to a 10-year moving average for each season. The depth dimension allows visualizing the gridded field at various depths.
-
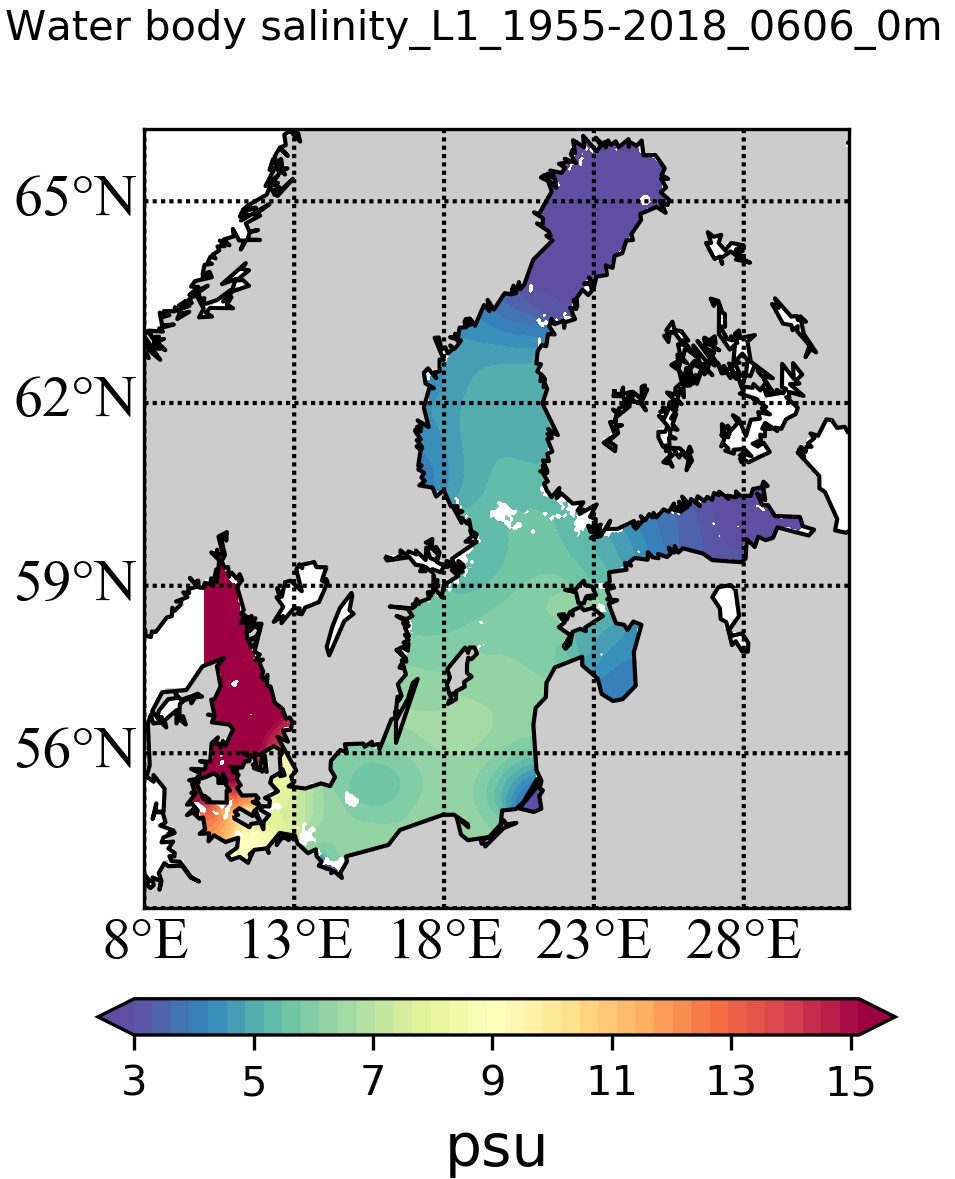
The SDC_BAL_CLIM_TS_V2 product contains temperature and salinity climatologies for the Baltic Sea, including seasonal and monthly fields for the period 1955-2018 and seasonal and monthly fields for 6 decades starting from 1955 to 2018. The climatological fields were computed from a merged Baltic Sea data set that combines data extracted from two major sources: 1) SeaDataNet infrastructure and 2) Coriolis Ocean Dataset for Reanalysis. The computation was done with the DIVAnd (Data-Interpolating Variational Analysis in n dimensions), version 2.6.3.
-
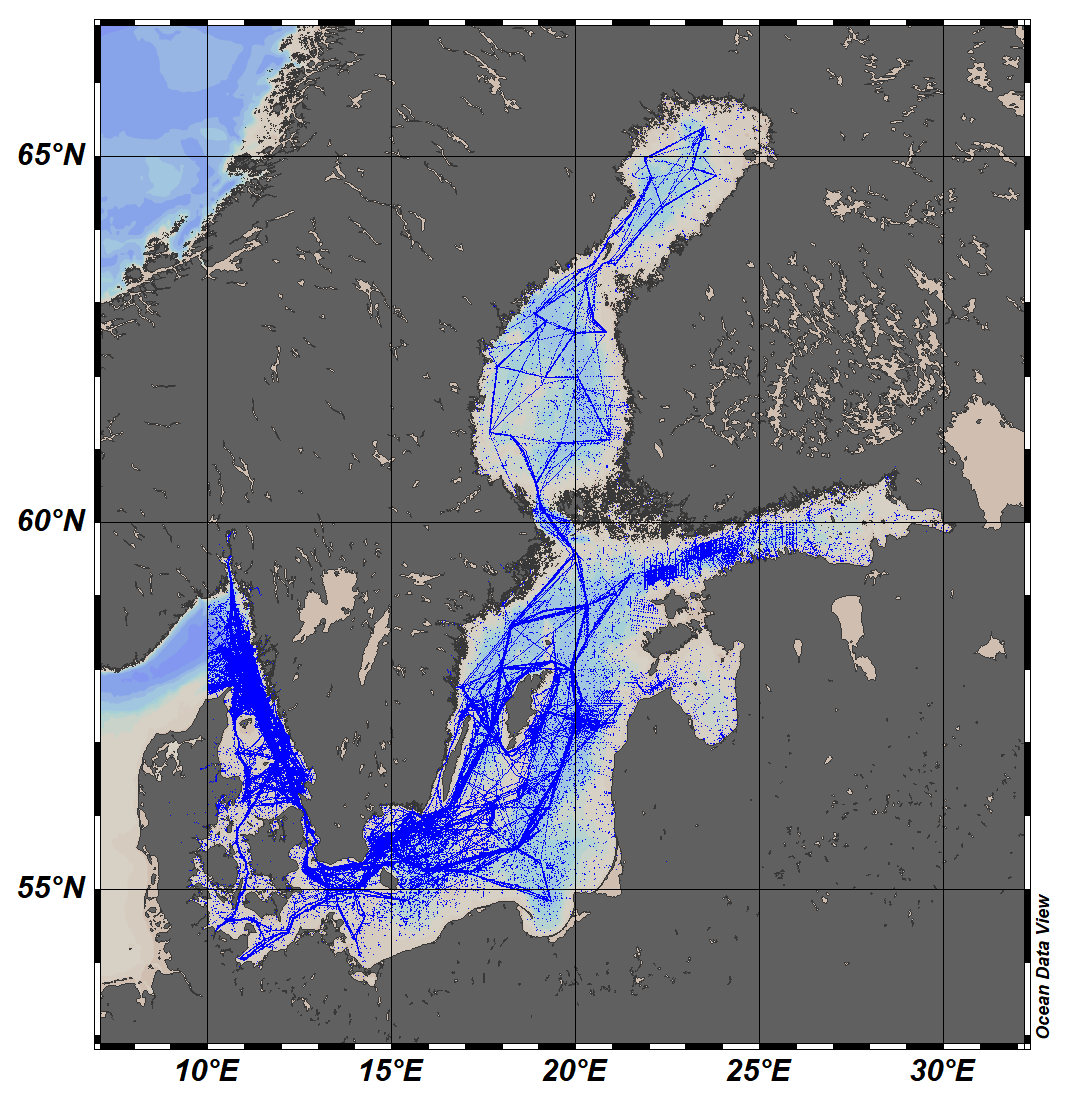
The SeaDataCloud Temperature and Salinity historical data collection for the Baltic Sea V2 includes open access in situ data on temperature and salinity of water column. The data were retrieved from the SeaDataNet infrastructure during summer 2019. Data have been quality controlled according to the SeaDataNet2 project QC procedures in conjunction with the visual expert check using the ODV software. The final number of stations in the collection is 481695, containing around 14.4 million values for both temperature and salinity. The dataset format is ODV binary collection which you can read, analyse and export from with the ODV application provided by the Alfred Wegener institute at http://odv.awi.de/. For data access please register at http://www.marine-id.org/.