 Metadata catalogue
surface
Type of resources
Available actions
Topics
INSPIRE themes
Keywords
Contact for the resource
Provided by
Years
Formats
Representation types
Update frequencies
status
Service types
Scale
-
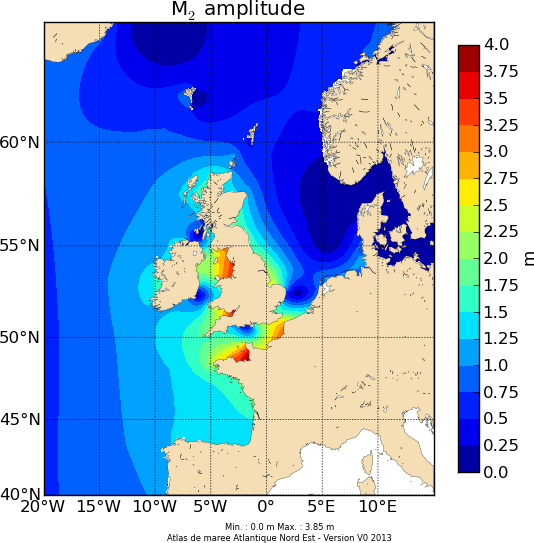
Les composantes harmoniques de hauteurs et courants ont été calculées à partir des modèles MARS2D de PREVIMER. Une analyse harmonique du rejeu 2008-2009 à l’aide de l'outil Tidal ToolBox (développé par le LEGOS) a permis de calculer les constantes harmoniques (amplitude et phase), à partir desquelles les hauteurs et courants de marée peuvent être prédits pour n’importe quelle période.
-
Radar Interferometry map of the Border of Belgium and Netherlands. The blue colours correspond to positive deformation (uplift) of the ground surface related to the recharge of a mining aquifer.
-
Evolution des prix des terres et prés à l'échelle départementale en France Métropolitaine, du prix des vignes en métropole et du prix des terres dans les Outre-Mer. Les données couvrent la période 2016-2020.
-
The harmonized geological map of Slovenia is a simplified version of the 1:250 000 scale Geological Map of Slovenia (Buser, 2009). This was compiled from the Geological Base Map of Slovenia at a scale of 1: 100.000 (contributed by various authors during the 1960's up to the 1980's) and the work was completed using new information gathered by Buser. The map is basically lithostratigraphic. The two layers incorporated in the map are lithostratigraphic units and major faults. The faults depicted on the map were selected using two criteria; regional extent and tectonic importance. The map presented here was edited specifically for the purpose of the OneGeology-Europe project by M. Bavec, M. Novak, M. Poljak, M. Trajanova and D. Skaberne.
-
The digital geological map of France at 1:1million scale is composed of layers of polygonal objects depicting stratigraphic units and lines depicting contours and faults.