 Metadata catalogue
bathymetry
Type of resources
Available actions
Topics
Keywords
Contact for the resource
Provided by
Years
Formats
Representation types
Update frequencies
status
Service types
Scale
-

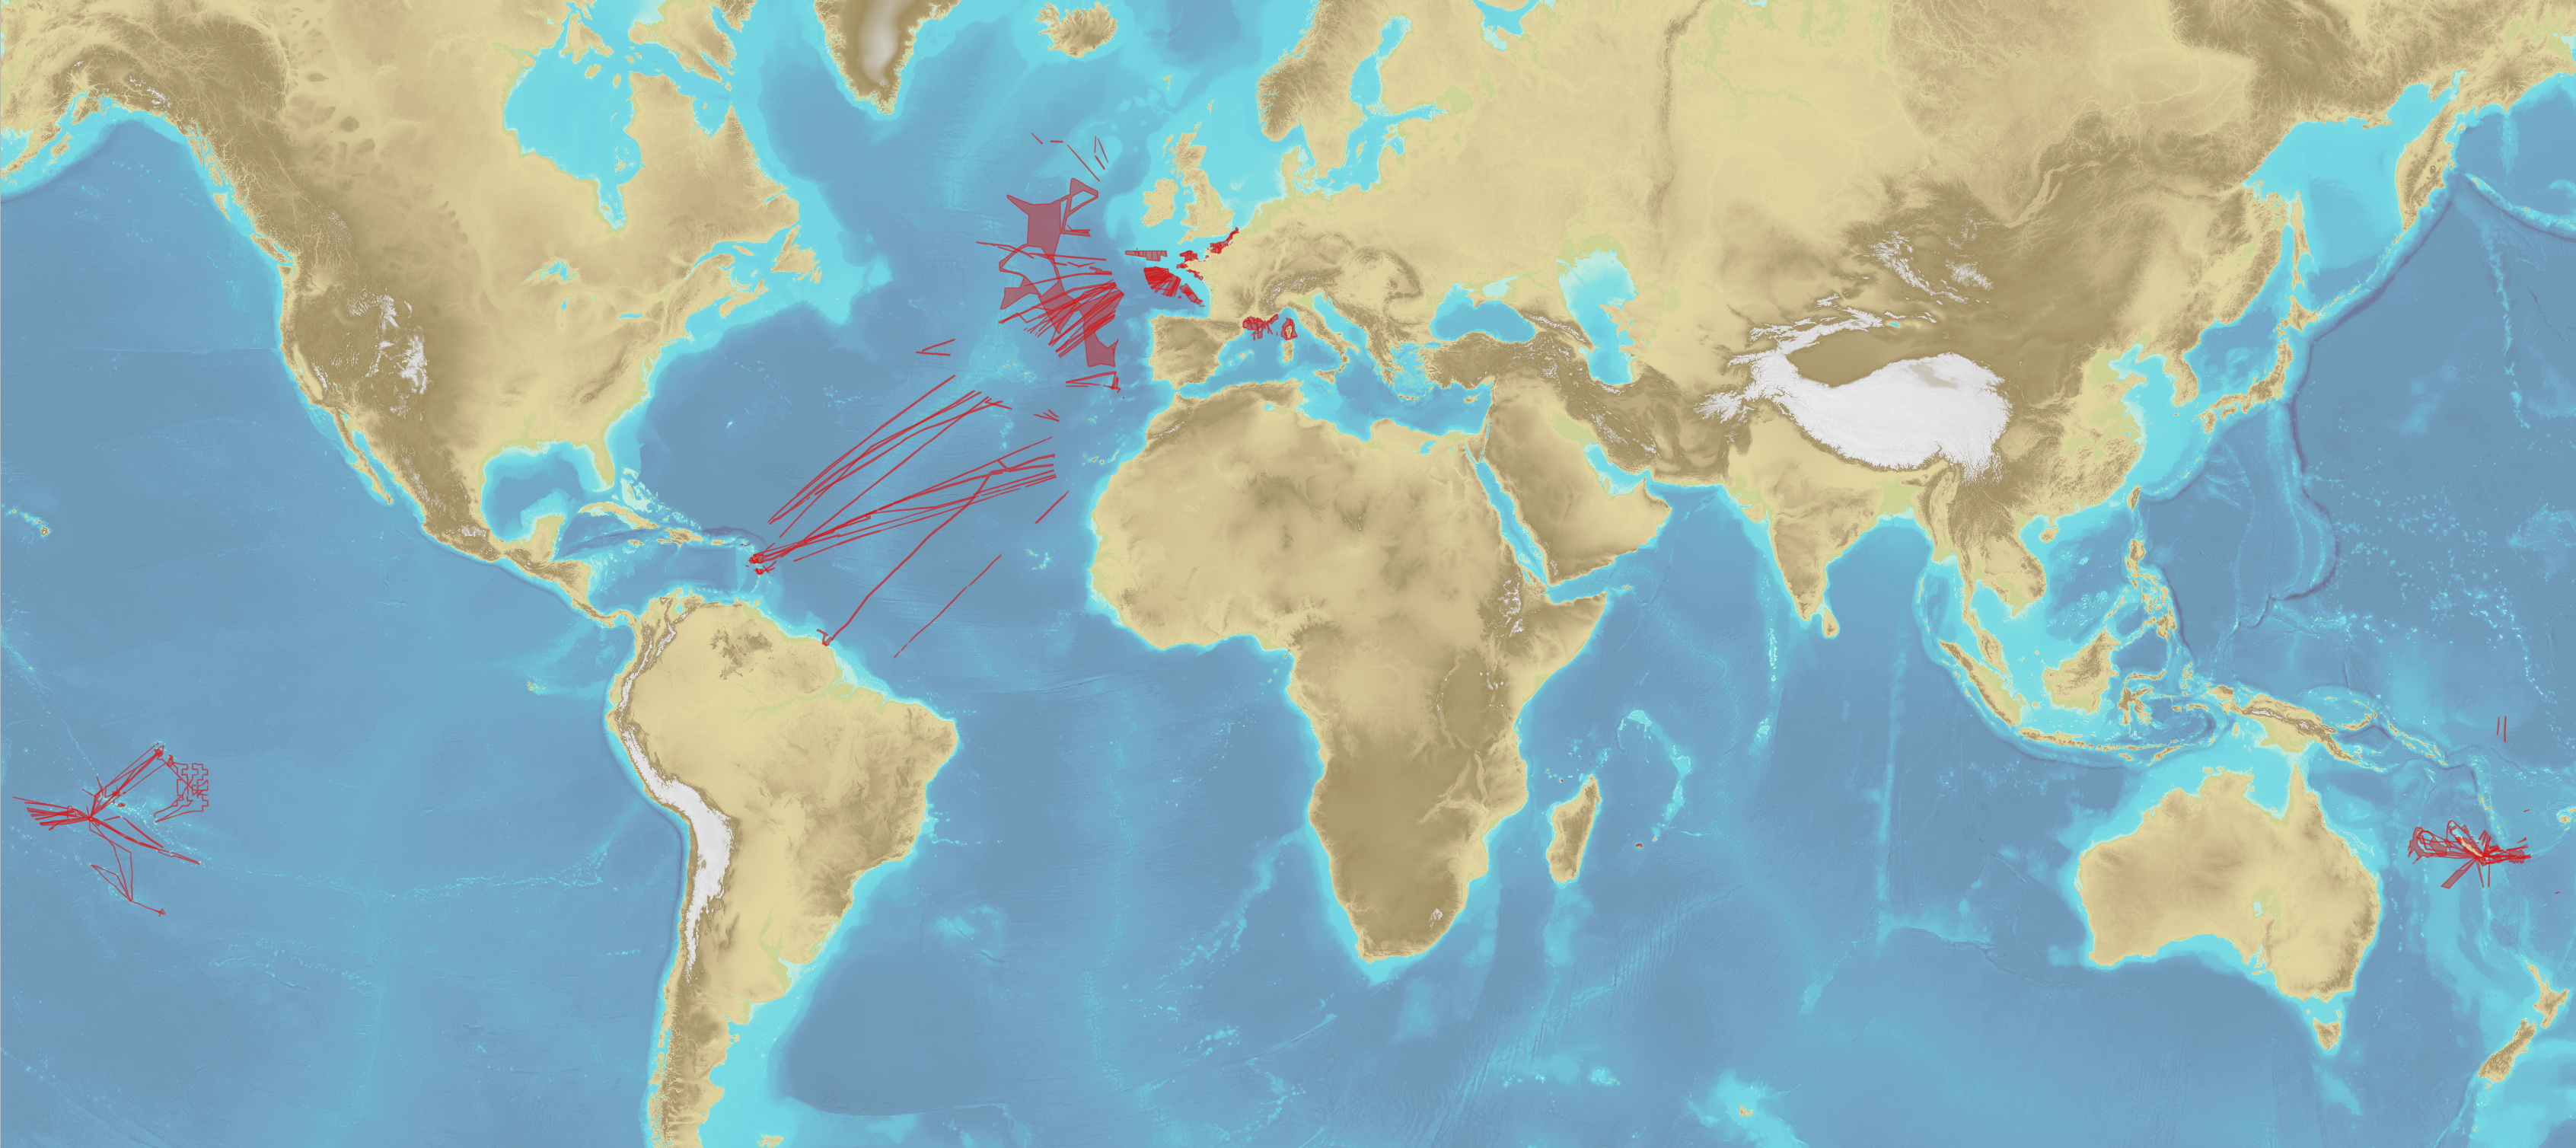
Bathymetric datasets are an extraction of surveys belonging to the Shom public database. For depth up to 50m, the vertical precision of soundings varies from 30cm to 1m and the horizontal precision varies from 1 to 20m. In deep ocean, the vertical precision is mainly around 1 or 2% of the bottom depth. It is sometimes more, it depends on the technology used. The data are referenced to ZH which is assimilated to LAT. Data are corrected for sound velocity variations.
-

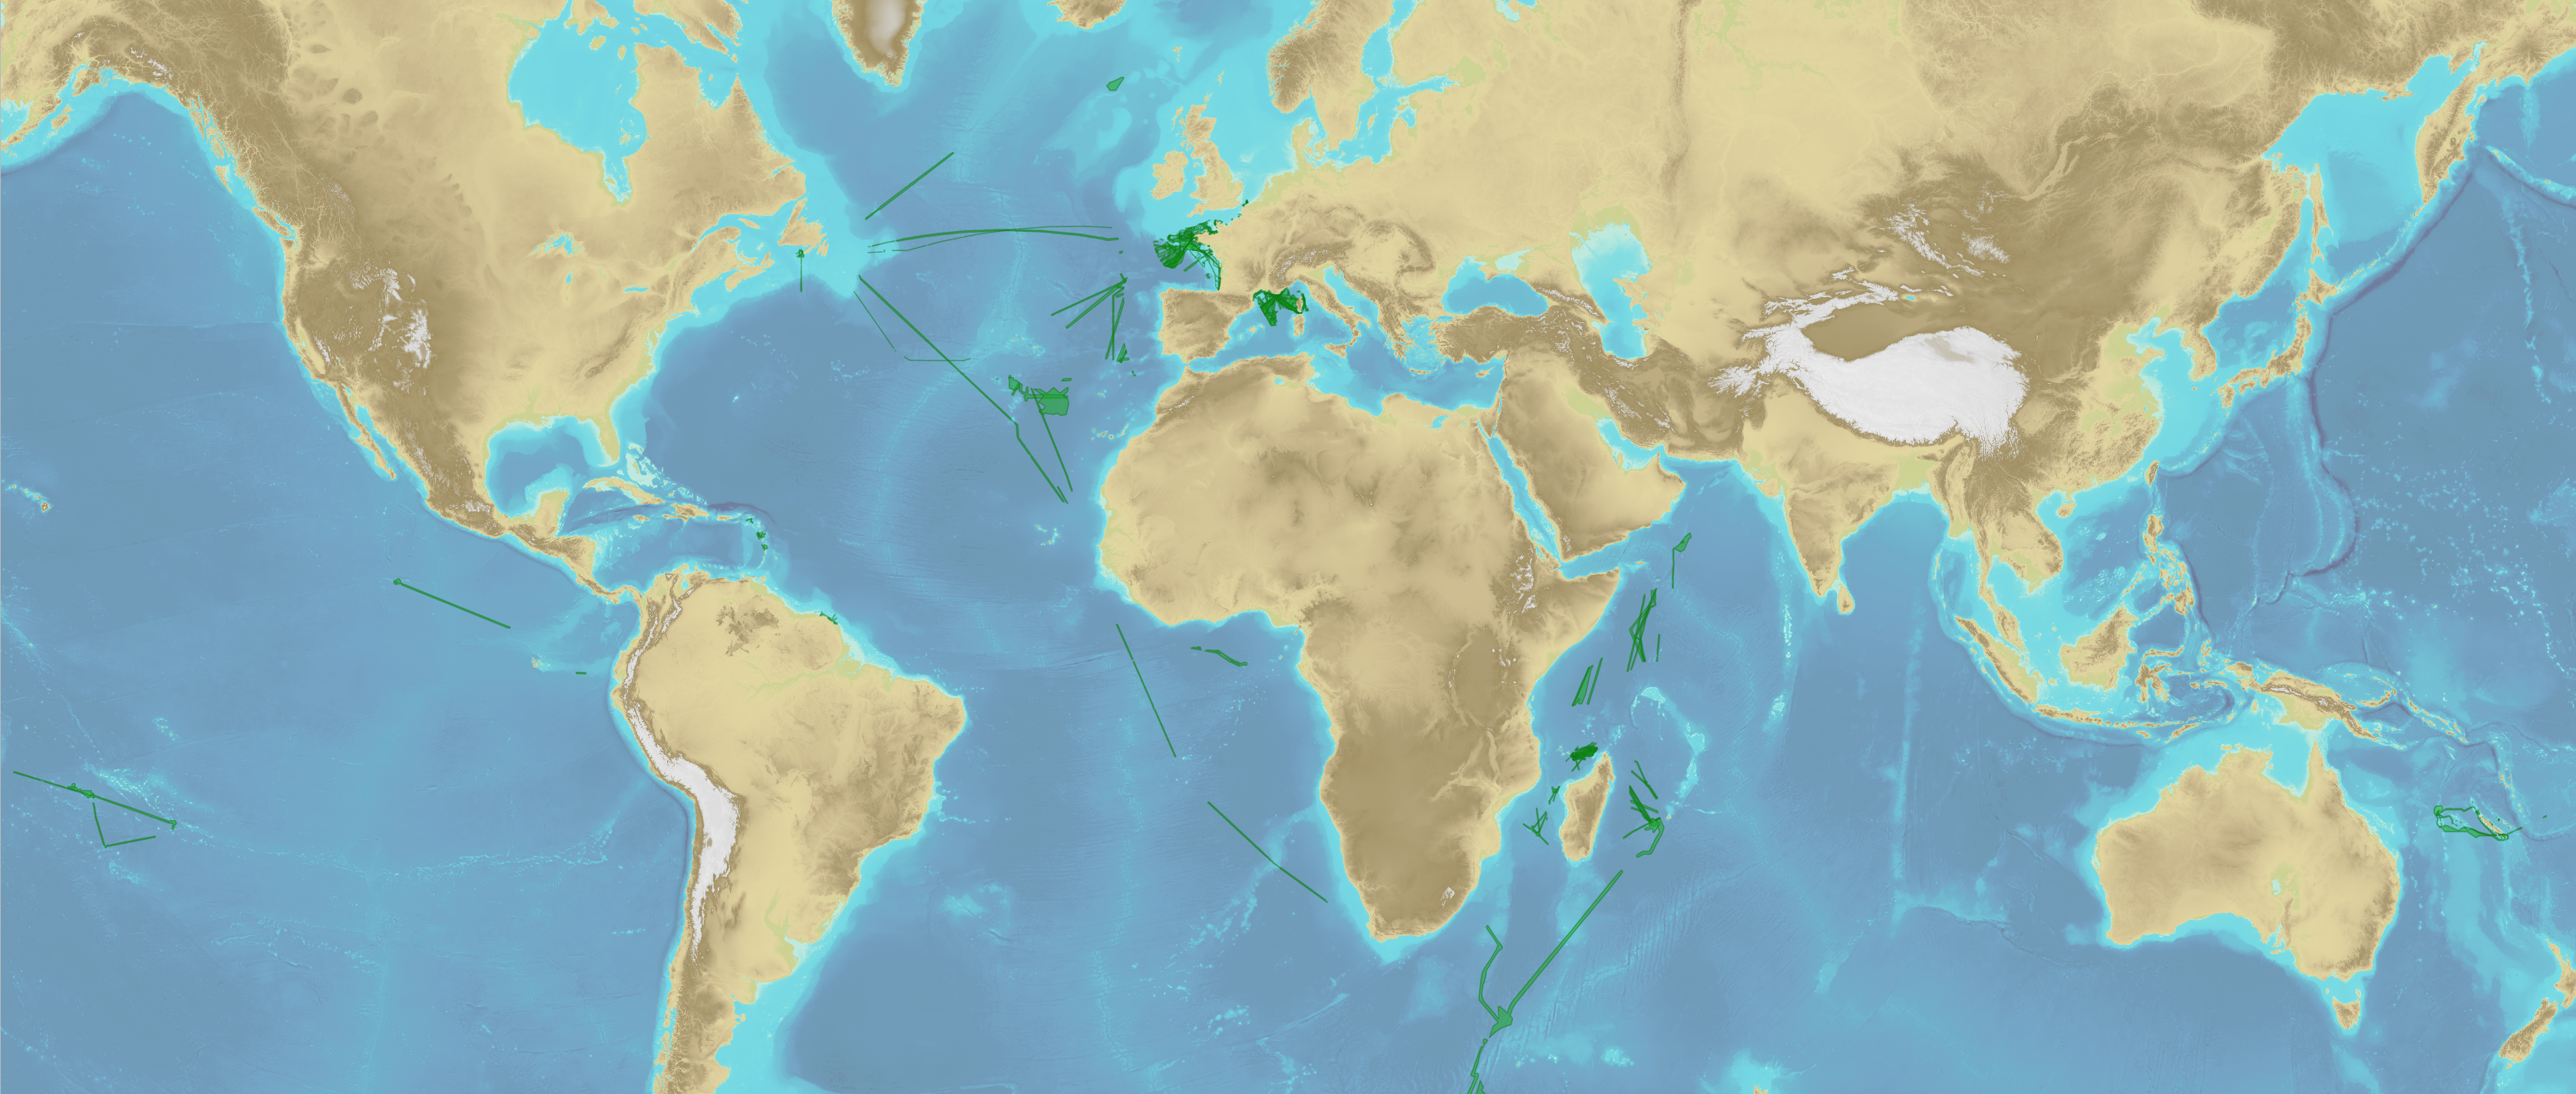
Bathymetric datasets are an extraction of surveys belonging to the Shom public database. For depth up to 50m, the vertical precision of soundings varies from 30cm to 1m and the horizontal precision varies from 1 to 20m. In deep ocean, the vertical precision is mainly around 1 or 2% of the bottom depth. It is sometimes more, it depends on the technology used. The data are referenced to ZH which is assimilated to LAT. Data are corrected for sound velocity variations.
-
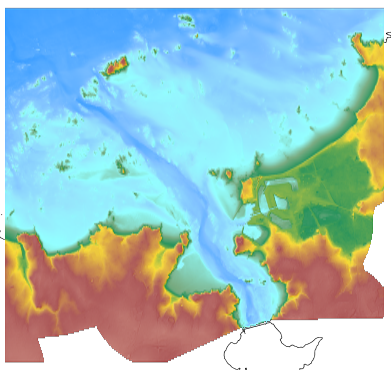
The coastal topo- bathymetric DEM of the port of Saint-Malo and its surroundings with a resolution of 0.00005° (~ 5 m) was prepared as part of the PAPI Saint-Malo. It covers the city of Saint-Malo and its surroundings, from the tip of Décollé in the west to the tip of Varde in the east. The DEM is designed to be implemented in the hydrodynamic models of the TANDEM project in order to estimate the coastal effects of tsunamis for the Atlantic and English Channel, where French nuclear power plants have been installed for about 30 years. This product is available with the Lowest Astronomic Tide (LAT) or the Mean Sea Level (MSL) as a vertical datum.
-
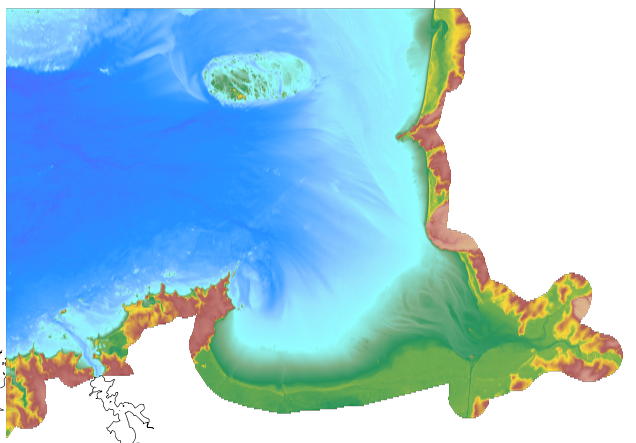
The coastal topo- bathymetric DEM of a part of the Norman-Breton gulf with a resolution of 0.0002° (~ 20 m) was prepared as part of the PAPI Saint-Malo. It covers the Minquiers plateau in the north-west to the bay of Mont-Saint-Michel in the south-east. The DEM is designed to be implemented in the hydrodynamic models of the TANDEM project in order to estimate the coastal effects of tsunamis for the Atlantic and English Channel, where French nuclear power plants have been installed for about 30 years. This product is available with the Lowest Astronomic Tide (LAT) or the Mean Sea Level (MSL) as a vertical datum.
-

The coastal topo-bathymetric DTM of the Arcachon basin and its surroundings at a resolution of 0.0002° (~ 20 m) was produced as part of the HOMONIM project. The DTM covers the coastline of a part of the Gironde department, from the Carcans and Hourtin ponds in the North, to the Cazaux and Sanguinet lakes in the South. It covers the entire Arcachon basin and extends offshore to about 40 m depth. The DTM is intended to be implemented in hydrodynamic models in order to produce accurate forecasts of water heights and sea states at the coast and to improve the French storm surge warning system. This product is available with the Lowest Astronomic Tide (LAT) or with the Mean Sea Level (MSL) as a vertical datum.
-
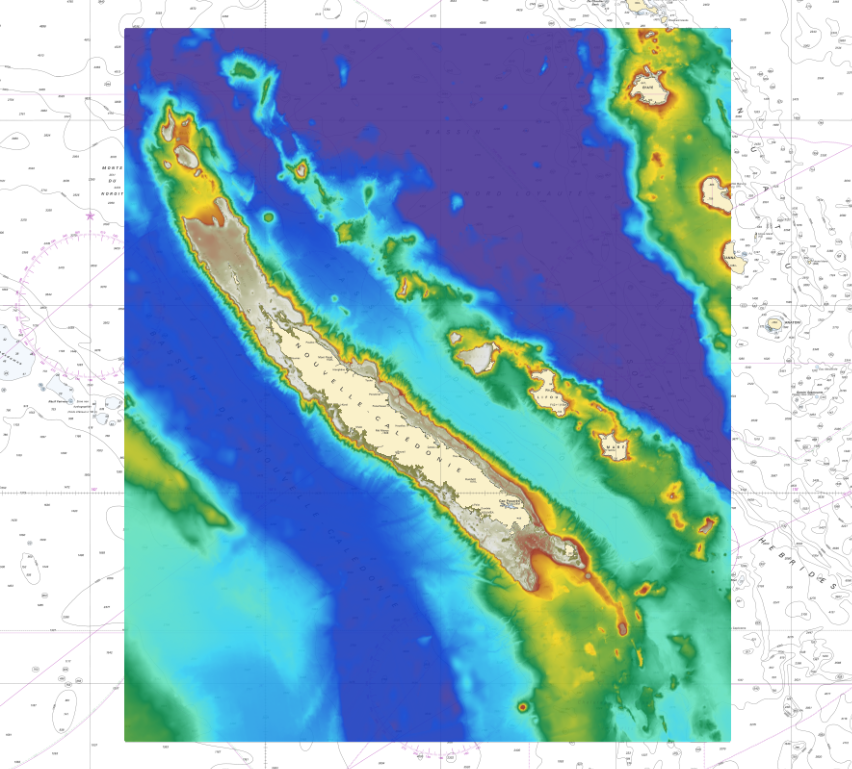
The bathymetric DEM for the coasts of New-Caledonia with a resolution of 0.001° (~ 100 m) was prepared in the framework of a Shom-IRD partnership as part of the TSUCAL project. The DEM covers the basin from New Caledonia in the west to the Vanuatu archipelago in the east. The DEM is designed to be used in hydrodynamic models in order to improve the pertinence of the Waves-Submersion monitoring programme.
-
These bathymetric data were produced using the interferometric side-scan sonar onboard the Haliotis Research Vessel, Operated by Genavir, for the French Oceanographic Fleet, in October 2022, during the oceanographic campaign HISOPE (l'Haliotis pour l’Imagerie Sismique d’Orbetello et Pyrgi Etrusques). The investigated area is located in front of the tombolo di Feniglia, in the Gulf of Porto Ercole. The goal of the campaign was to image the sedimentary architecture of the Tombolo di Feniglia Acquisition took place from October 1st to October 6th 2022. Data were acquired by eng. Quentin Layahe, Genavir, onboard the Haliotis, piloted by Serge Garcia, and post-processed using the software Globe, developed by the IFREMER, by Dr.Gilles Brocard (Archéorient, University of Lyon 2, France) and Alessandro Conforti, research engineer at the CNR (Italian national center for research) at Orosi, Sardinia.
-

The data was collected during the survey NOMADS 09 (2009) conducted by the SHOM on the R/V Laplace. The bathymetry of the shelf edge and upper slope of the Moroccan Western Rifan continental Margin offshore the Spartel Headland (South of Gulf of Cadiz)) higtlights a field of NS trending kilometer-scale bathymetric ridges with elevation reaching more than 20m above surrounding seabed.