 Metadata catalogue
WP4 Benthic Mapping
Type of resources
Available actions
Topics
INSPIRE themes
Keywords
Contact for the resource
Provided by
Years
Formats
Representation types
Update frequencies
status
Scale
Resolution
-

Infield Systems, now part of Wood Mackenzie (for the full news story please follow this link), is an energy research and analysis firm that is dedicated to the provision of accurate and up-to-date information, databases, research, market forecasts, mapping, commercial market due-diligence, transaction support, business strategy, analysis and intelligence to the global offshore oil, gas, renewable energy and associated marine industries. Over the past 25 years Infield Systems has developed an extensive range of products and services to assist industry professionals, analysts and investors with their business and investment decisions. Within its core markets, Infield Systems has become widely acknowledged as one of the definitive resources of information, research and analysis. Infield Systems services clients from a wide range of organisations including exploration and production companies, service suppliers, offshore contractors, manufacturers, government agencies, financial institutions and investors. In addition Infield provides information, analysis and commentary for the energy trade press and at industry conferences through presentation of papers and keynote speeches. Products and services are broadly divided into the following key areas: - Data Services - Research - Business Strategy & Analysis - Transaction Services
-
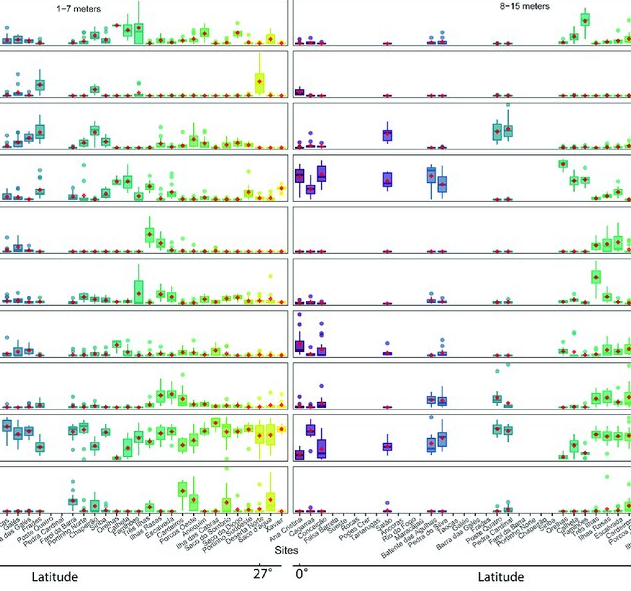
As marine ecosystems are influenced by global and regional processes, standardized information on community structure has become crucial for assessing broad-scale responses to natural and anthropogenic disturbances. Extensive biogeographic provinces, such as the Brazilian Province in the southwest Atlantic, present numerous theoretical and methodological challenges for understanding community patterns on a macroecological scale. In particular, the Brazilian Province is composed of a complex system of heterogeneous reefs and a few offshore islands, with contrasting histories and geophysical-chemical environments. Despite the large extent of the Brazilian Province (almost 8,000 kilometers), most studies of shallow benthic communities are qualitative surveys and/or have been geographically restricted. We quantified community structure of shallow reef habitats from 0° to 27°S latitude using a standard photographic quadrat technique. Percent cover data indicated that benthic communities of Brazilian reefs were dominated by algal turfs and frondose macroalgae, with low percent cover of reef-building corals. Community composition differed significantly among localities, mostly because of their macroalgal abundance, despite reef type or geographic region, with no evident latitudinal pattern. Benthic diversity was lower in the tropics, contrary to the general latitudinal diversity gradient pattern. Richness peaked at mid-latitudes, between 20°S to 23°S, where it was ~3.5-fold higher than localities with the lowest richness. This study provides the first large-scale description of benthic communities along the southwestern Atlantic, providing a baseline for macroecological comparisons and evaluation of future impacts. Moreover, the new understanding of richness distribution along Brazilian reefs will contribute to conservation planning efforts, such as management strategies and the spatial prioritization for the creation of new marine protected areas.
-
Maritime Spatial Planning (MSP) is globally recognised as a crucial tool for managing human uses and activities in maritime space, with the aim of supporting sustainable growth and development in the maritime sector and conscious use of marine and coastal resources. MSP identifies where and when human uses and activities take place in maritime space today and may take place in the future. GeoPortal SIGMAR offers a view of the maritime space of the Azores and its uses.
-
Marine research is truly multidisciplinary as evidenced by e.g. the EMODnet I, II, and III projects that have been running since 2009. EMODnet Geology has succeeded in bringing together harmonised offshore data including sea-floor geology, seabed substrates, rates of coastline migration, geological events and probabilities and mineral resources. The EMODnet Geology Portal aims at providing harmonised information on marine geology in Europe. It is one of several EMODnet portals with the purpose to strengthen blue growth in Europe.
-

Reef fish represent one of the most diverse vertebrate groups on Earth, with over 7,000 species distributed around the globe. This richness is not evenly distributed geographically. The Atlantic (AT) and the Eastern Pacific (EP) encompass 30% of the global fish fauna. These areas have been considered the most isolated from the marine biodiversity hotspot in the Indo-Pacific due to distinct physical barriers, such as the Tethyan closure and the distance between the EP and the western Pacific. Despite their comparatively lower species richness, these realms host unique fish assemblages characterized by a remarkable proportion of regional endemics and species with large body size. Here, we present the largest database of life-history traits and biogeographical and conservation aspects presently available for the reef fish fauna of the AT and the EP realms. The database includes 21 traits distributed into behavioral (home range, diel activity, group size, level in the water column, three measures of preferred temperature), morphological (maximum body size, size class, body shape, aspect ratio, caudal fin, mouth position), and ecological (trophic level, diet, spawning strategy, depth of occurrence, two allometric constants, pelagic larval duration, and life span), as well as biogeographical (geographic range index, range extension, species distribution in 20 marine provinces, latitude north and south of occurrence, total number of provinces where species occur, occurrence in the AT and EP), and conservation aspects (IUCN status, vulnerability and global market price). We compiled these data through a careful review of 104 local checklists published between 1982 and 2020, online repositories, local reports, books, and monographs on specific families or genera. We limited our database to localities situated between latitudes 51°N and 45°S that including shallow and upper mesophotic biogenic and/or rocky reefs habitats. Our database covers 2,198 species belonging to 146 families and 655 reef fish genera distributed in two marine realms (1,458 in the AT, 829 in the EP, and 89 in both realms) and 20 marine provinces. This database of reef fish offers the opportunity to explore novel ecological and evolutionary questions at different scales and provides tools for species conservation based on these traits. There are no copyright or proprietary restrictions for research or teaching purposes.
-
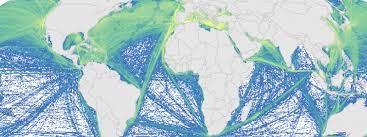
This is a portion of the data used to calculate 2008 and 2013 cumulative human impacts in: Halpern et al. 2015. Spatial and temporal changes in cumulative human impacts on the world's ocean. Seven data packages are available for this project: (1) supplementary data (habitat data and other files); (2) raw stressor data (2008 and 2013); (3) stressor data rescaled by one time period (2008 and 2013, scaled from 0-1); (4) stressor data rescaled by two time periods (2008 and 2013, scaled from 0-1); (5) pressure and cumulative impacts data (2013, all pressures); (6) pressure and cumulative impacts data (2008 and 2013, subset of pressures updated for both time periods); (7) change in pressures and cumulative impact (2008 to 2013). All raster files are .tif format and coordinate reference system is mollweide wgs84. Here is an overview of the calculations: Raw stressor data -> rescaled stressor data (values between 0-1) -> pressure data (stressor data after adjusting for habitat/pressure vulnerability) -> cumulative impact (sum of pressure data) -> difference between 2008 and 2013 pressure and cumulative impact data. This data package includes 2008 and 2013 raw stressor data. The 2008 data includes 18 raster files (preceeded by raw_2008_). The 2013 data includes 19 raster files (preceeded by raw_2013_). There is no sea level rise data for 2008.
-
The EuroMapApp task of the AtlantOS project aims to integrate Europe’s existing and future bathymetric data sets from the Atlantic Ocean into a seamless whole and put these results into a widely accessible format allowing immediate visualization of the seafloor for the specialist and non-specialist user alike. The partner institutions are GEOMAR, Ifremer, NIOZ, and NERC-BODC.
-

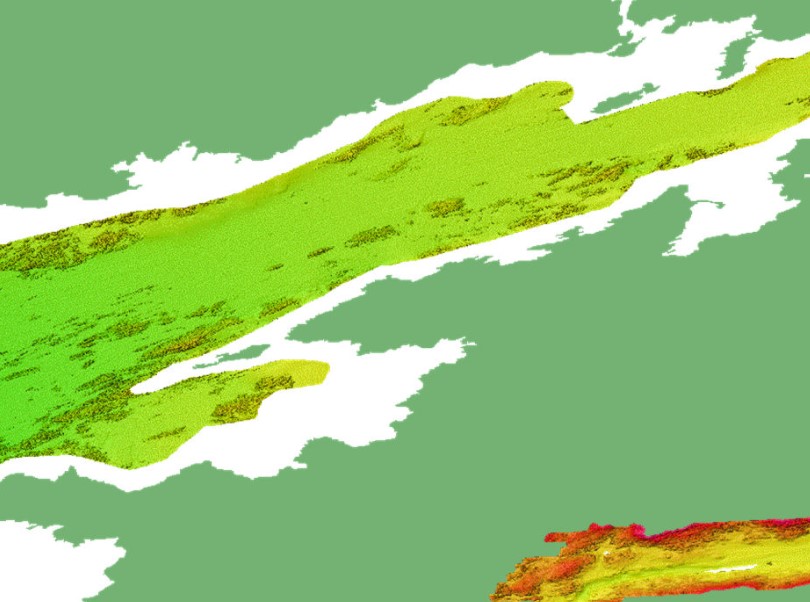
Morphological map (10 classes) of the Irish shelf resulting from the modal aggregation (Cell statistics “MAJORITY” in ArcGIS Pro 3.1) of the qualitatively and quantitatively best Fully Convolutional Neural Networks models obtained in the study: Arosio, R., Hobley, B., Wheeler, A. J., Sacchetti, F., Conti, L. A., Furey, T. and A. Lim, 2023. Fully convolutional neural networks applied to large-scale marine morphology mapping. Frontiers in Marine Science, Sec. Ocean Observation, 10, https://doi.org/10.3389/fmars.2023.1228867.
-
The GEBCO_2022 Grid is a global continuous terrain model for ocean and land with a spatial resolution of 15 arc seconds. In regions outside of the Arctic Ocean area, the grid uses as a base Version 2.4 of the SRTM15_plus data set (Tozer, B. et al, 2019). This data set is a fusion of land topography with measured and estimated seafloor topography. Included on top of this base grid are gridded bathymetric data sets developed by the four Regional Centers of The Nippon Foundation-GEBCO Seabed 2030 Project. The GEBCO_2022 Grid represents all data within the 2022 compilation. The compilation of the GEBCO_2022 Grid was carried out at the Seabed 2030 Global Center, hosted at the National Oceanography Centre, UK, with the aim of producing a seamless global terrain model. Outside of Polar regions, the Regional Centers provide their data sets as sparse grids i.e. only grid cells that contain data are populated. These data sets were included on to the base using a remove-restore blending procedure. This is a two-stage process of computing the difference between the new data and the base grid and then gridding the difference and adding the difference back to the existing base grid. The aim is to achieve a smooth transition between the new and base data sets with the minimum of perturbation of the existing base data set. The data sets supplied in the form of complete grids (primarily areas north of 60N and south of 50S) were included using feather blending techniques from GlobalMapper software. The GEBCO_2022 Grid has been developed through the Nippon Foundation-GEBCO Seabed 2030 Project. This is a collaborative project between the Nippon Foundation of Japan and the General Bathymetric Chart of the Oceans (GEBCO). It aims to bring together all available bathymetric data to produce the definitive map of the world ocean floor by 2030 and make it available to all. Funded by the Nippon Foundation, the four Seabed 2030 Regional Centers include the Southern Ocean - hosted at the Alfred Wegener Institute, Germany; South and West Pacific Ocean - hosted at the National Institute of Water and Atmospheric Research, New Zealand; Atlantic and Indian Oceans - hosted at the Lamont-Doherty Earth Observatory, Columbia University, USA; Arctic and North Pacific Oceans - hosted at Stockholm University, Sweden and the Center for Coastal and Ocean Mapping at the University of New Hampshire, USA.
-
The INtegrated Mapping FOr the Sustainable Development of Ireland's MArine Resource (INFOMAR) programme is a joint venture between the Geological Survey of Ireland (GSI) and the Marine Institute (MI). The programme is the successor to the Irish National Seabed Survey (INSS) and concentrates on creating integrated mapping products related to the seabed. INFOMAR Seabed Samples Particle Size Analysis represent locations where samples have been taken and particle size analysis (PSA) carried out on samples. Sediment type classification based on percentage sand, mud and gravel (after Folk 1954). Every sediment is a mixture of grains of varying sizes. It groups grains into mud, sand and gravel on the basis of their diameter. The relative proportion of the grains in the three categories is then used to describe the sediment and is displayed in a diagram commonly called a “Folk triangle”. This classification has 15 terms to describe the seabed sediments. Samples from the seabed are taken by grab and box core sampling instruments. PSA is applied to determine the range of sediment sizes contained in the sample which can often reveal an insight about the processes operating in the depositional environment. The results show percentage gravels, sands, silt and mud present in the sample. This analysis is also used to determine if the sample is well or poorly sorted.