 Metadata catalogue
Spatial data products
Type of resources
Available actions
Topics
INSPIRE themes
Keywords
Contact for the resource
Provided by
Years
Formats
Representation types
status
Scale
Resolution
-

MAREANO maps depth and topography, sediment composition, biodiversity, habitats and biotopes, and pollution in the seabed in Norwegian coastal and offshore regions. MAREANO is coordinated by the Institute of Marine Research, in collaboration with the Geological Survey of Norway and the Norwegian Hydrographic Service. The Programme is financed by the Ministry of Fisheries and Coastal Affairs, the Ministry of Environment and the Ministry of Trade and Industry, via contributions from the National Budget. The Programme aims to provide answers to questions such as: - How is the seascape of the Norwegian continental shelf? - What does the seabed consist of? - How is the biodiversity distributed on the seabed? - How are habitats and biotopes distributed on the seabed? - What is the relationship between the physical environment, biodiversity and biological resources? - How much contaminants are stored in the bottom sediments? The Institute of Marine Research, the Geological Survey of Norway and the Norwegian Mapping Authority comprise the Executive Group which is responsible for carrying out the MAREANO field sampling and other scientific activities. The Programme Group, led by the Norwegian Environment Agency, has the executive responsibility for the MAREANO activities.
-
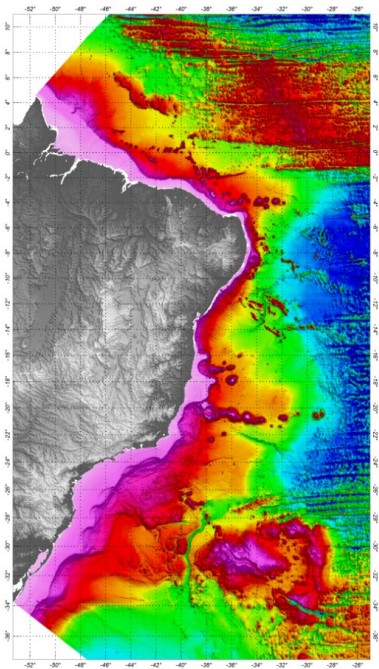
The Digital Terrain Model was developed based on all available bathymetric data, already processed and validated. The SRTM30_PLUS (Shuttle Radar Topography Mission) data were used just to complement the bathymetric grid in distal regions of the Brazilian Continental Margin. In order to prepare the bathymetric grid from a database composed by all qualified bathymetric information, it was adopted the Randgrid.GX/Geosoft - Oasis Montaj®, version 9.5.2, routine. The used mathematical model creates a surface of minimum curvature, using a similar method to that proposed by Swain (1976) and Briggs (1974), with the interpolation, in each knot of the grid, of X and Y values in metric coordinates and Z values (variable). The calculated surface adjusts itself to the irregularly sampled original values. The grid cell-size was 1,000 m, defined according the spatial distribution of the available data. The Brazilian DTM Oasis grid file was converted to surfer files, Versions V6 and V7. The ASCII file and a Geotif image were also provided. The reference system and geodetic datum adopted for the bathymetric data was the WGS84. The projection adopted was the World Mercator (false N=0, false E=0, latitude of the natural origin=0 longitude of the natural origin=0, and the scaling factor of the natural origin=1).
-
Maritime Spatial Planning (MSP) is globally recognised as a crucial tool for managing human uses and activities in maritime space, with the aim of supporting sustainable growth and development in the maritime sector and conscious use of marine and coastal resources. MSP identifies where and when human uses and activities take place in maritime space today and may take place in the future. GeoPortal SIGMAR offers a view of the maritime space of the Azores and its uses.
-
Marine research is truly multidisciplinary as evidenced by e.g. the EMODnet I, II, and III projects that have been running since 2009. EMODnet Geology has succeeded in bringing together harmonised offshore data including sea-floor geology, seabed substrates, rates of coastline migration, geological events and probabilities and mineral resources. The EMODnet Geology Portal aims at providing harmonised information on marine geology in Europe. It is one of several EMODnet portals with the purpose to strengthen blue growth in Europe.
-
To assess the status of the South and Tropical Atlantic marine ecosystem and develop a framework for predicting its future changes, from months to decades, by combining ecosystem observations, climate-based ecosystem prediction and information on future socio-economic and ecosystem service changes, and thus to contribute to the sustainable management of human activities in the Atlantic Ocean as a whole. TRIATLAS contributes to this by delivering knowledge of the current state and future changes of the Atlantic marine ecosystems. We achieve this goal through a basin-wide approach that integrates research from the North and South, and that closes critical knowledge gaps in the Tropical and South Atlantic that impede an understanding of the entire basin. 33 partners from 13 countries Project duration: June 2019 – May 2023 Monthly model biomass values for the best fitted Ecosim model of the Southern Benguela ecosystem for the period 1978-2015. The model was driven by fishing effort/mortality and a forcing function applied to phytoplankton, based on a cumulative upwelling index, and was fitted to available catch and abundance time-series data.
-
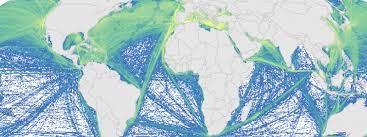
This is a portion of the data used to calculate 2008 and 2013 cumulative human impacts in: Halpern et al. 2015. Spatial and temporal changes in cumulative human impacts on the world's ocean. Seven data packages are available for this project: (1) supplementary data (habitat data and other files); (2) raw stressor data (2008 and 2013); (3) stressor data rescaled by one time period (2008 and 2013, scaled from 0-1); (4) stressor data rescaled by two time periods (2008 and 2013, scaled from 0-1); (5) pressure and cumulative impacts data (2013, all pressures); (6) pressure and cumulative impacts data (2008 and 2013, subset of pressures updated for both time periods); (7) change in pressures and cumulative impact (2008 to 2013). All raster files are .tif format and coordinate reference system is mollweide wgs84. Here is an overview of the calculations: Raw stressor data -> rescaled stressor data (values between 0-1) -> pressure data (stressor data after adjusting for habitat/pressure vulnerability) -> cumulative impact (sum of pressure data) -> difference between 2008 and 2013 pressure and cumulative impact data. This data package includes 2008 and 2013 raw stressor data. The 2008 data includes 18 raster files (preceeded by raw_2008_). The 2013 data includes 19 raster files (preceeded by raw_2013_). There is no sea level rise data for 2008.
-
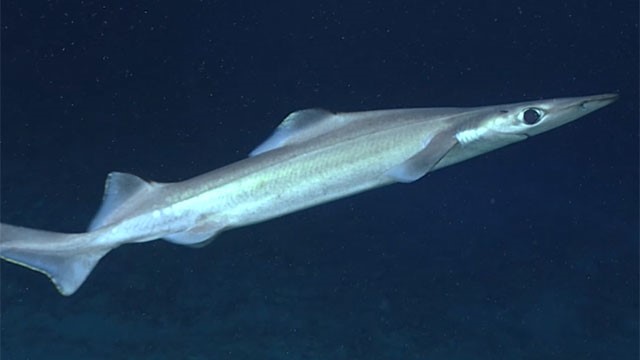
We developed predictive distribution models of deep-sea elasmobranchs for up to 2000 m depth in the Azores EEZ and neighboring seamounts, from approximately 33°N to 43°N and 20°W to 36°W. Georeferenced presence, absence, and abundance data were obtained from scientific surveys and commercial operations reporting at least one deep-sea elasmobranch capture. A 20-year 'survey dataset' (1996-2017) was compiled from annual scientific demersal surveys using two types of bottom longlines (types LLA and LLB), and an 'observer dataset' (2004-2018) from observer programs covering commercial fisheries operations using bottom longline (similar to type LLA) and vertical handline ('gorazeira').
-

The EuroMapApp task of the AtlantOS project aims to integrate Europe’s existing and future bathymetric data sets from the Atlantic Ocean into a seamless whole and put these results into a widely accessible format allowing immediate visualization of the seafloor for the specialist and non-specialist user alike. The partner institutions are GEOMAR, Ifremer, NIOZ, and NERC-BODC.
-

Morphological map (10 classes) of the Irish shelf resulting from the modal aggregation (Cell statistics “MAJORITY” in ArcGIS Pro 3.1) of the qualitatively and quantitatively best Fully Convolutional Neural Networks models obtained in the study: Arosio, R., Hobley, B., Wheeler, A. J., Sacchetti, F., Conti, L. A., Furey, T. and A. Lim, 2023. Fully convolutional neural networks applied to large-scale marine morphology mapping. Frontiers in Marine Science, Sec. Ocean Observation, 10, https://doi.org/10.3389/fmars.2023.1228867.
-
The GEBCO_2022 Grid is a global continuous terrain model for ocean and land with a spatial resolution of 15 arc seconds. In regions outside of the Arctic Ocean area, the grid uses as a base Version 2.4 of the SRTM15_plus data set (Tozer, B. et al, 2019). This data set is a fusion of land topography with measured and estimated seafloor topography. Included on top of this base grid are gridded bathymetric data sets developed by the four Regional Centers of The Nippon Foundation-GEBCO Seabed 2030 Project. The GEBCO_2022 Grid represents all data within the 2022 compilation. The compilation of the GEBCO_2022 Grid was carried out at the Seabed 2030 Global Center, hosted at the National Oceanography Centre, UK, with the aim of producing a seamless global terrain model. Outside of Polar regions, the Regional Centers provide their data sets as sparse grids i.e. only grid cells that contain data are populated. These data sets were included on to the base using a remove-restore blending procedure. This is a two-stage process of computing the difference between the new data and the base grid and then gridding the difference and adding the difference back to the existing base grid. The aim is to achieve a smooth transition between the new and base data sets with the minimum of perturbation of the existing base data set. The data sets supplied in the form of complete grids (primarily areas north of 60N and south of 50S) were included using feather blending techniques from GlobalMapper software. The GEBCO_2022 Grid has been developed through the Nippon Foundation-GEBCO Seabed 2030 Project. This is a collaborative project between the Nippon Foundation of Japan and the General Bathymetric Chart of the Oceans (GEBCO). It aims to bring together all available bathymetric data to produce the definitive map of the world ocean floor by 2030 and make it available to all. Funded by the Nippon Foundation, the four Seabed 2030 Regional Centers include the Southern Ocean - hosted at the Alfred Wegener Institute, Germany; South and West Pacific Ocean - hosted at the National Institute of Water and Atmospheric Research, New Zealand; Atlantic and Indian Oceans - hosted at the Lamont-Doherty Earth Observatory, Columbia University, USA; Arctic and North Pacific Oceans - hosted at Stockholm University, Sweden and the Center for Coastal and Ocean Mapping at the University of New Hampshire, USA.