 Metadata catalogue
Soil
Type of resources
Available actions
Topics
INSPIRE themes
Keywords
Contact for the resource
Provided by
Years
Formats
Representation types
Update frequencies
status
Service types
Scale
Resolution
-
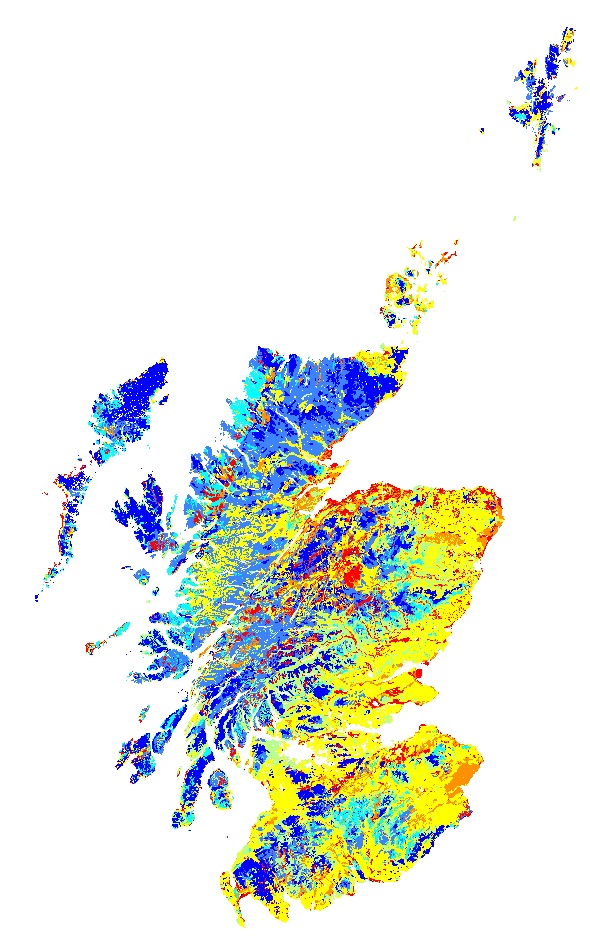
The proportion of water held in the soil at field capacity (5KPa) and at the permanent wilting point (1500kPa) was calculated for each soil horizon of each soil taxonomic unit (soil series) delineated within the 1:250 000 national soil map of Scotland based on pedotransfer functions (regression equations using median sand, silt, clay and organic carbon contents from the Scottish soils knowledge and information base (SSKIB) derived for soils in the UK (Hollis et al., 2015). The Available Water Content for each horizon was calculated by subtracting the water content at 1500 KPa from the water content at 5 kPa. The horizon thickness was then multiplied by the available water content (mm) and summed for the entire soil profile to 1 m or rock if <1m. The map shows the average available water capacity calculated using the areal proportions of all soils in each 1:250 000 soil map unit. Gagkas, Z., Lilly, A., Baggaley, N. & Donnelly, D. (2019). Map of available water capacity of soils in Scotland. James Hutton Institute. Aberdeen. Please note that this dataset differs significantly to the version of Available Water Capacity published in 2012. The difference results from the use of different regression equations to predict available water capacities (Hollis et al.) and bulk densities. In addition, the data values shown are weighted averages by polygon rather than the AWC of the dominant soil type in the polygon. The earlier version of AWC was published as Lilly, A, Baggaley, N and Donnelly, D. 2012. Map of available water content to 1 metre depth in soils of Scotland. Map prepared for EU project GS-SOIL-Assessment and strategic development of INSPIRE compliant Geodata-Services for European Soil Data. ECP-2008-GEO-318004.
-

This service is the digital (vector) version of the Soils of Scotland 1:250,000 maps plus the National Soil Inventory of Scotland 10 km survey. Refer to the datasets for more information.
-

This dataset is based on the digital (vector) version of the Soils of Scotland 1:250,000 maps and the Land Cover of Scotland 1988. The topsoil carbon percentage in this data set has been computed using data from the Scottish Soils Knowledge Base (SSKIB).
-
Scottish Natural Heritage (SNH) has prepared a consolidated spatial dataset of peat depth measurements collected across Scotland. The information was collected during peat depth surveys conducted as part of various assessments carried out on sites that formed part of the Peatland ACTION project (2012-2019). Surveys were conducted using the Peat depth survey guidance issued by Peatland Action program. The current version of the dataset provides all available data on 26 July 2019. Additional datasets will be added to the database when they become available. The surveys were conducted at a high spatial resolution (100 m grid) over a wide geographical spread of the sites across Scotland. The current version includes data collected from 142 projects with 25,119 individual survey points. The average peat depth across all 142 projects is 1.50 m with a maximum depth of 11.0 m.
-

In Malta the spatial pattern of soil types is very intricate, both semi-natural and agricultural areas and different soil types often occur within a single field or within a distance of few meters. In the national soil inventory of the Maltese Islands (MALSIS) established in 2014, soils were described according to the criteria of the World Reference Base for Soil Resources. Seven major soil reference groups were identified: Leptosols, Vertisols, Calcisols, Luvisols, Cambisols, Regosols and Arenosols. Soils were also classified into Soil Landscape Units, which consist of soil containing a range of soil types which are likely to have similar management characteristics. The soil landscapes are divided into semi-natural landscapes with a low human impact and man-made landscapes where human influence is demonstrated by the extensive terracing of slopes, creation of ‘made ground’ or intensive cultivation. Key to abbreviations of the soil landscape types: BCs – Blue Clay slopes; BCTm – Blue Clay moderate terraces; BCTs – Blue Clay steep terraces; BCsp – Blue Clay spring; BS – Blown sand; BST – Blown sand terraces; Clf – Cliffs; CTm – Coralline moderate terraces; CTs – Coralline steep terraces; CTv - Coralline shallow terraces; Ga – Garrigue; GTm – Globigerina moderate terraces; GTs - Globigerina steep terraces; GTv - Globigerina shallow terraces; M – Marsh; U – Urban; VF – Valley fill; W – Woodland.
-
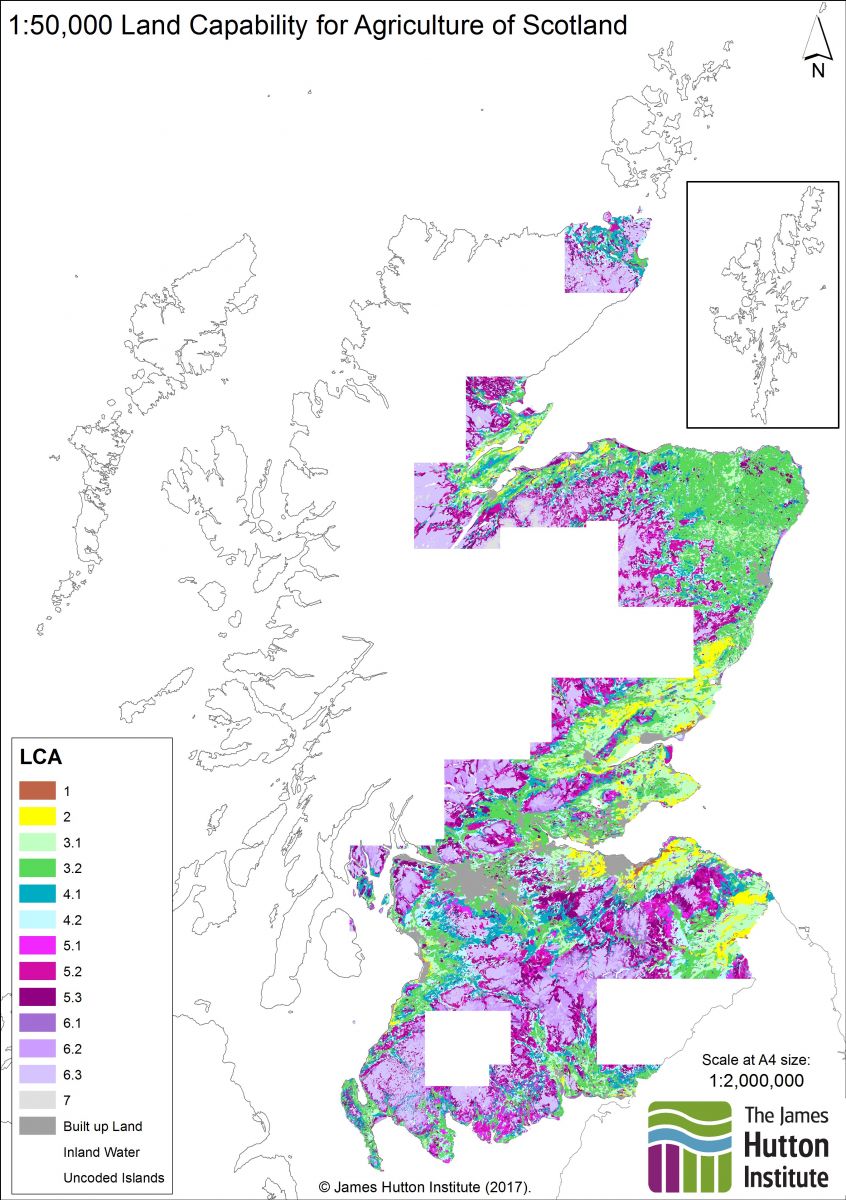
This service is the digital (vector) version of the Land Capability for Agriculture of Scotland 1:50,000 maps. Also known as "Land capability for agriculture (partial cover)". Refer to the datasets for more information.
-

This service is the digital (vector) version of the Land Capability for Agriculture of Scotland 1:250,000 maps. Refer to the datasets for more information.
-
The map shows the risk of water flowing overland (runoff) carrying potential pollutants into water courses. This map primarily covers the cultivated land in Scotland. The digital dataset gives information on the likelihood of a potential pollutant applied to the soil surface running off the land to a water course in 3 classes: Low, Moderate or High and is based on fundamental soil characteristics such as depth to a slowly permeable layer, soil porosity and flow pathways through the soil.
-
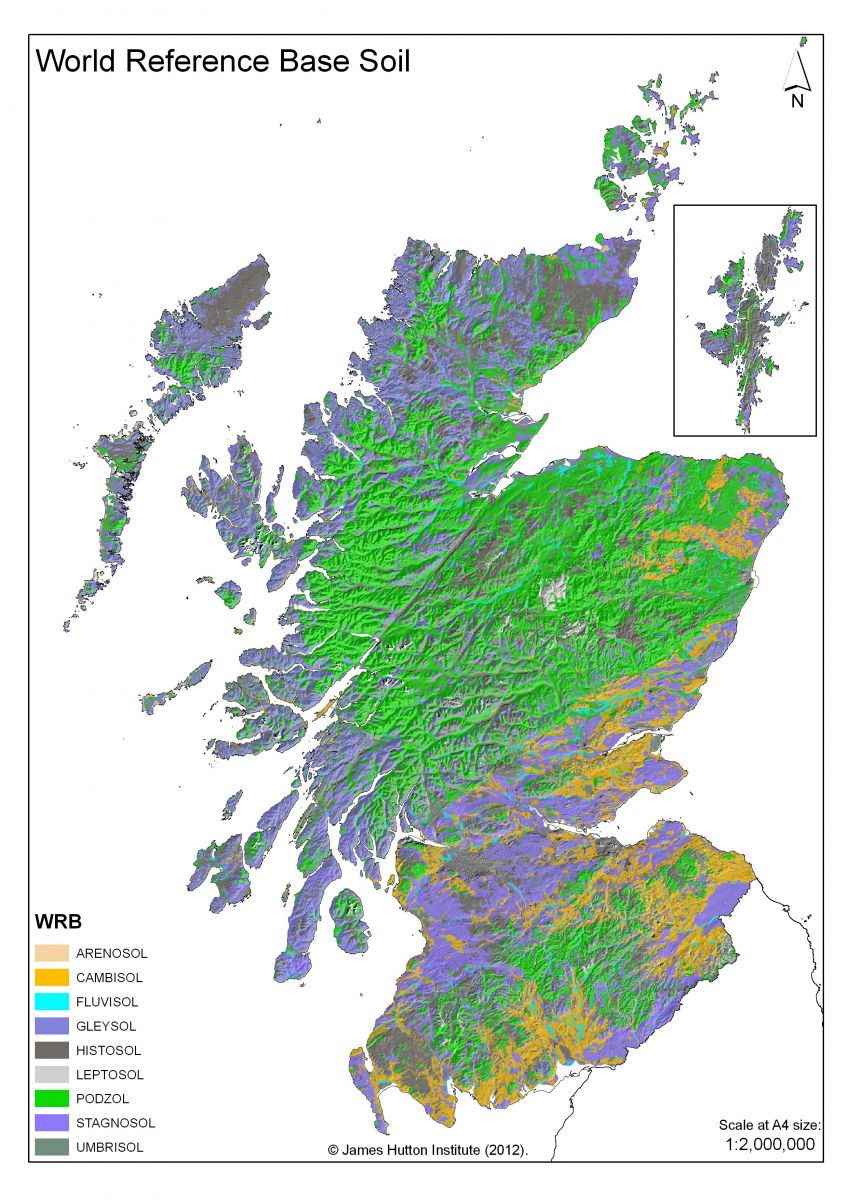
In order to generate a soil map of Scotland using the WRB soil classification system, the dominant soil taxonomic unit in each 1:250 000 scale soil map units were classified according to the diagnostic criteria laid out in WRB 2007 (IUSS Working Group WRB, 2007) and following the updated procedures for constructing small scale map legends (IUSS Working Group WRB, 2010). As the intention was to produce a map at a notional scale of 1:1 000 000, the soils were classified to the level of the Reference Soil Group and two qualifiers. Boorman, D.B., Hollis, J.M and Lilly, A. 1995. Hydrology of soil types: a hydrologically-based classification of the soils of the United Kingdom. Institute of Hydrology Report No.126. Institute of Hydrology, Wallingford. IUSS Working Group WRB. 2007. World Reference Base for Soil Resources 2006, first update 2007. World Soil Resources Reports No. 103. FAO, Rome. IUSS Working Group WRB. 2010. Addendum to the World Reference Base for Soil Resources: Guidelines for constructing small-scale map legends using the World Reference Base for Soil Resources. FAO, Rome. Soil Survey of Scotland Staff. (1981). Soil maps of Scotland at a scale of 1:250 000. Macaulay Institute for Soil Research, Aberdeen.
-
This is a simplified version of the Carbon and Peatland 2016 map for use in the development of windfarm spatial framework. It only shows the extent of areas within Class 1 and 2 of the classification. To access the unabridged version, select the Carbon and Peatland 2016 dataset.Scottish Natural Heritage (SNH) has prepared a consolidated spatial dataset of "carbon rich soil, deep peat and priority peatland habitats" in Scotland derived from existing soil and vegetation data (James Hutton Institute 1:25,000 and 1:250,000 scale soil data and Land Cover Scotland 1988). The resulting Carbon and Peatland map updated earlier work undertaken by SNH for the identification of natural heritage features of national importance available from Scotland's soil website. The map is a high-level planning tool to promote consistency and clarity in the preparation of spatial frameworks by planning authorities. The map is a predictive tool which provides an indication of the likely presence of peat on each individually-mapped area, at a coarse scale. The types of peat shown on the map are carbon-rich soils, deep peat and priority peatland habitat.