 Metadata catalogue
Sea temperature
Type of resources
Available actions
Topics
Keywords
Contact for the resource
Provided by
Years
Formats
-
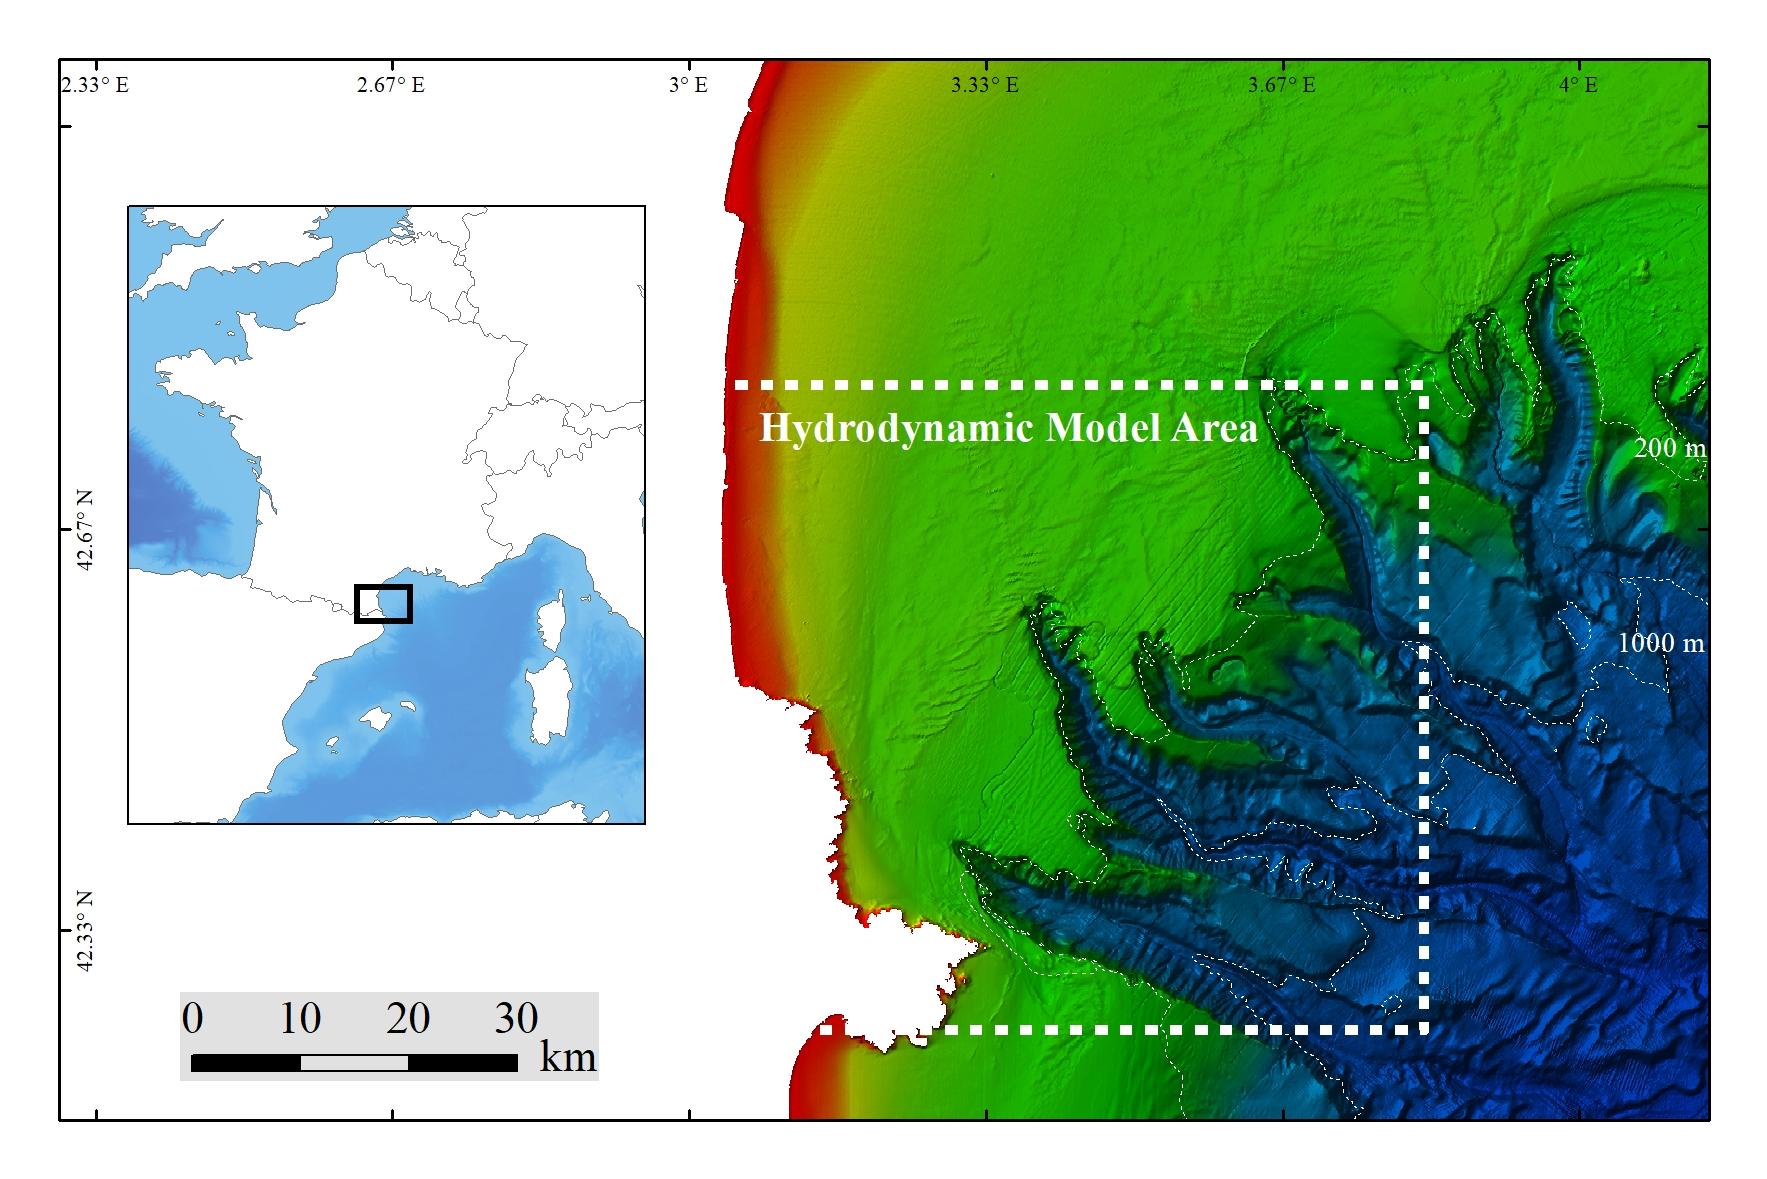
Extreme percentiles (1%, 5%, 95%, 99%) of bottom temperature and salinity, as well as (95%, 99%) of bottom currents, were modeled using SYMPHONIE on a numerical domain covering 65 × 60 km at a resolution of 80 m. The 10-m bathymetry used inside the Lacaze-Duthiers Canyon was collected during the CALADU_2021 cruise (https://doi.org/10.17600/18001575). Statistics of extreme values were derived from hourly fields simulated between November 1, 2012, and April 15, 2014. This period includes two contrasting winters: the winter of 2012–2013, which was cold with dense water cascading, and the winter of 2013–2014, which was warm. This dataset was produced to assess the probable distribution of habitats (habitat suitability modeling) for cold-water corals in the Lacaze-Duthiers Canyon at different resolutions as part of the European H2020 project REDRESS (Restoration of Deep-Sea Habitats to Rebuild European Seas, https://redress-project.eu/, Grant Agreement No. 101135492). SYMPHONIE is a component of the national service SIROCCO (research infrastructure ILICO). This dataset is related to the article "Mapping and Conservation of Cold-Water Corals in the Lacaze-Duthiers Canyon for Transboundary Management", submitted to Mediterranean Marine Science by Fabri et al. in 2025.
-
As part of the EPIGRAM project, two moorings, Aspex 9 and 10, equipped with temperature, conductivity and pressure sensors (Seabird microcat 37SM), were deployed offshore Aquitaine for a period of 2 years (2009-2011). The probes were calibrated in metrology and provide salinity values derived from calculations based on Fofonoff and Millard (1983) [Fofonoff, P. and Millard, R.C. Jr UNESCO 1983. Algorithms for computation of fundamental properties of seawater. UNESCO Tech. Pap. in Mar. Sci., No. 44, 53 pp. Eqn.(31) p.39. http://unesdoc.UNESCO.org/images/0005/000598/059832eb.pdf]. Several oceanographic missions ASPEX1, 2, 3 and 4, were dedicated to deploying and recovering these instruments. The frame of the mooring (Figure B) is laid on the seafloor with sensors at 0.5 m above it. Aspex 9 and 10 moorings are located at the continental shelf (at 148 m water depth) and continental slope (at 472 m water depth), respectively (Fig. A). Aspex 9 mooring recorded data from 18.07.2009 at 23:40:00 to 01.07.2010 at 09:18:00 (with a measurement every 120 seconds) and from 04.09.2010 at 23:30:00 to 10.08.2011 at 06:57:00 (with a measurement every 180 seconds). Aspex 10 mooring recorded data from the 18.07.2009 at 21:40:00 to 22.07.2010 at 23:18:01 and from 05.09.2010 at 01:20:00 to 10.08.2011 at 04:58:00 (with a measurement every 120 seconds). This ASPEX dataset can be downloaded from here: a zip file containing one .txt file with indications of recording time, location and water depth of the two moorings and four data files (one .txt file per mooring and per recorded period) with for each measurement the year (YYYY), month (MM), day (DD), hour (hh), minute (mm) second (ss) and pressure (P), temperature (T), conductivity (C) and salinity (S) values. As part of the PAMELA project, 18 XBT (eXpendable BathyThermograph) probes (Sippican) were launched in 2013 (July to September) offshore Aquitaine Basin. Seawater temperature profiles were thus acquired through the water column from different locations at the shelf area (at 140 m water depth), the continental slope and the basin (at 1213 m water depth) (Fig. A). Some of these XBT profiles are accessible via the Coriolis platform (http://www.coriolis.eu.org/). The complete GAZCOGNE1-2 dataset can be downloaded from here: a zip file containing one .txt file with indications of time, location and water depth for the XBTs and 18 data files (one .txt file per XBT profile). All times are in UTC.
-
Mooring data at Yermak Pass from September 2017 to July 2020 : raw and 50 hr high pass filtered data

The mooring was deployed on 15 September 2017 from Norwegian Research Vessel Lance at 80.6°N and 7.26°E (depth of 730 m) in the Yermak Pass over the Yermak Plateau north of Svalbard. It comprised 3 instruments: an upward-looking RDI 75kHz, a Long Ranger Acoustic Doppler Current Profiler (ADCP) at 340 m with 16 m vertical resolution (25 bins of 16 m each) and a 2-hour sampling time; a Seabird SBE37 measuring temperature, salinity and pressure at 348 m with 10-minute sampling time; and an Aquadopp current meter at 645 m with a 2-hour sampling time. The mooring was retrieved on the 19 July 2020 by Norwegian Icebreaker K.V. Svalbard. The present dataset features: The ADCP 50-hour high pass filtered velocities and the Aquadopp 50-hour high pass filtered velocities.
-
The mooring was deployed on 15 September 2017 from Norwegian Research Vessel Lance at 80.6°N and 7.26°E (depth of 730 m) in the Yermak Pass over the Yermak Plateau north of Svalbard. It comprised 3 instruments: an upward-looking RDI 75kHz, a Long Ranger Acoustic Doppler Current Profiler (ADCP) at 340 m with 16 m vertical resolution (25 bins of 16 m each) and a 2-hour sampling time; a Seabird SBE37 measuring temperature, salinity and pressure at 348 m with 10-minute sampling time; and an Aquadopp current meter at 645 m with a 2-hour sampling time. The mooring was retrieved on the 19 July 2020 by Norwegian Icebreaker K.V. Svalbard. The present dataset features: (i) the ADCP 50-hour smoothed daily velocities, conservative temperature and pressure time series interpolated every 10 meters within the 20-330m layer, (ii) the Aquadopp 50-hour smoothed daily velocities and pressure time series at 645 m; and (iii) the SBE37 50-hour smoothed daily conservative temperature, absolute salinity and pressure time series at 348 m.
-
IAOOS14, IAOOS15 and IAOOS25 were deployed from the Korean Icebreaker R/V Araon during cruises in the northern Chukchi Sea. IAOOS14 and IAOOS15 were deployed 300 m apart on the same floe on 12 August 2015 in the Makarov Basin (80.8°N;173°E) and they drifted together remaining always less than 6 km apart. IAOOS25 was deployed on 15 August 2017 south-west Mendeleev Ridge (77.7°N;180°E) and drifted westward to the continental slope of the East Siberian Sea. IAOOS14 and IAOOS25 stopped transmitting on 9 October 2015 and 19 November 2017 respectively, likely due to the loss of their profilers while crossing relatively shallow bathymetry. IAOOS15 dataset ends in 15 October 2015. Ocean profilers were PROVOR SPI (from French manufacturer NKE) equipped with a Seabird SBE41 CTD (Conductivity, Temperature, Depth) and a dissolved oxygen (DO) Aandera 4330 optode. The profilers were set to perform two upward profiles a day from 800 m (IAOOS 14), 300 m (IAOOS 15) and 420 m (IAOOS 25), upward starting at approximately 6 am and 6 pm. The present dataset is composed of CTD-DO data from IAOOS 14 and 15, and CTD data from IAOOS 25 in the Makarov Basin, corrected from salinity errors and interpolated vertically every 0.5 m.
-
The SeaExplorer glider Sea028 was deployed from the research vessel R/V Lance on the 24 July 2017 at 78.65°N, 9.70°E, on the western slope of Svalbard. The glider was recovered on 7 August 2017 at 79.99°N, 9.51°E. It performed six crossing of the western Svalbard slope. The glider was equipped with a GPCTD (Glider Payload Conductivity Temperature Depth from SeaBird), a dissolved oxygen sensor (Sea Bird SBE43F), and an optical sensor measuring Chlorophyll a (470/695 nm), Colored Dissolved Organic Matter (CDOM, 370/460 nm), and the total particle concentration or backscatter (backscattering at 700 nm) (EcoPuck from Wetlabs). The dataset is composed of the data corrected from the thermal lag and the sensor lag, despiked and interpolated every 1m. The profiles are separated. Please note that the oxygen data are not accurate for the second half of the time series (sensor bias).
-
The SeaExplorer glider Sea028 was deployed from the research vessel R/V Lance on the 15 September 2017 at 79.5°N, 8.6°E, on the western slope of Svalbard. The glider was recovered on 23 September 2017 at 80.62°N, 13.83°E.The glider was equipped with a GPCTD (Glider Payload Conductivity Temperature Depth from SeaBird), a dissolved oxygen sensor (Sea Bird SBE43F), and an optical sensor measuring Chlorophyll a (470/695 nm), Colored Dissolved Organic Matter (CDOM, 370/460 nm), and the total particle concentration or backscatter (backscattering at 700 nm) (EcoPuck from Wetlabs). The dataset is composed of the data corrected from the thermal lag and the sensor lag, despiked and interpolated every 1m. The profiles are separated.
-
Arctic Western Eurasian Basin: IAOOS 23 and IAOOS 24 ocean CTD-DO, CDOM and nitrate profiles in 2017
The two platforms IAOOS 23 and IAOOS 24 were deployed within 600 m from each other at the North Pole from the Russia-operated Barneo ice camp on April 12, 2017. They followed a meandering trajectory, reaching as far as 30°E in the Nansen Basin, before turning back to the western Fram Strait. On both IAOOS 23 and 24, the ocean profiler was a PROVOR SPI (from French manufacturer NKE) equipped with a Seabird SBE41 CTD (Conductivity, Temperature, Depth) and a dissolved oxygen (DO) Aandera 4330 optode. For the first time, the profiler on IAOOS 23 also carried biogeochemical sensors. It featured a bio-optics sensor suite and a submersible ultraviolet nitrate analyzer (SUNA, Satlantic-Seabird Inc.). The bio-optics sensor suite (called Pack Rem A) combines a three-optical-sensor instrument (ECO Triplet, WET Labs Inc.) and a multispectral radiometer (OCR-504, Satlantic Inc.). The present dataset is composed of CTD-DO data from IAOOS 23 and 24, corrected from the thermal lag and the sensor lag, despiked and interpolated vertically every 0.5 m. It also comprises nitrate concentrations from the SUNA and CDOM fluorescence from the WETLabs ECO sensor on IAOOS 23. Other biogeochemical data will be added to this dataset. The profilers were set to perform two upward profiles a day from 250 m (IAOOS 23) and 350 m (IAOOS 24) upward starting at approximately 6 am and 6 pm. They provided a unique 8-month long dataset, gathering a total of 793 profiles of the temperature, salinity and oxygen (upper 350m) and 427 profiles of CDOM and nitrates concentrations (upper 250m).
-
The CARBO-ACID research cruise (EUROFLEETS+ SEA02_10) was carried out on the RV Ramón Margalef between August 2nd and August 11st, with departing from Vigo – Spain and ending in Lisbon – Portugal. The main objective of this cruise was to collect data and samples to study the potential effects of ocean acidification on carbonate marine organisms (coccolithophores, pteropods, planktonic and benthic foraminifera, and corals) along the Iberian margin. With this objective, oceanographic data and water samples, plankton, cold-water corals and sediment samples were collected during an upwelling season, along two transects coinciding with the two persistent upwelling filaments off the Iberia Margin: the Cape Finisterra and the Cape Roca. In this dataset is guiven all the acquired data recollected onboad. During the CARBO-ACID cruise we did a total of 7 stations, 4 stations along the Cape Finisterra transect (from W to E: CA3, CA2, CA7, CA8) and 3 stations at the Cape Roca (from W to E: CA6, CA5, CA4) transect (Fig). At each station we usually started with a multibeam survey, a CTD and Rosette cast. These initial operations allowed to identify the different water masses present in this area, characterize their physical properties and to recover seawater samples at specific depth levels. The seawater samples were onboard subsampled, preserved in cold conditions or with chemicals and/ or filtered for several further analysis in the shore-based laboratories: DNA, chlorophyll, fitoplankton, coccolithophores, pH, alkalinity, stable isotopic composition, trace elements concentration and Suspend Particulate Matter. Subsequently to these operations, at each station, two vertical tows with a plankton multinet (with 5 nets) were done on the top 700 m of the water column to sample the planktonic communities of the different water depths. After this, sediment samples were recovered with a box-corer to study the past oceanographic conditions, between the pre-industrial Era and the Present, with multi-proxies used in paleoceanography and sedimentology. A total of 10 box-cores were recollected and each of them was onboard sub-sampled for eDNA, enzymes and benthic foraminifera. Fifteen shipek grab samples were recollected at the Fontanelas seamount (Estremadura Spur), station CA6, to characterize the sedimentary cover and to evaluate the presence of deep cold-water corals. Preliminary results show that the stations CA7, CA8 and CA4, located close to the coast, as expected, are the most influenced by the coastal upwelling, exhibiting colder surface water, higher values of fluorescence, and more zooplankton content reflecting higher phyto-zooplankton concentrations, as typical of the upwelling waters. At station CA4 temperature was higher and fluorescence showed lower values, indicative of less phytoplankton, and interpreted as indicating a different upwelling source water from that upwelled further north. Based on the CTD data, the Cape Roca transect is more influenced by the subtropical East North Atlantic Central Water (ENACWst), while the Cape Finisterra transect is more under the influence of the subpolar branch (ENACWsp). Seafloor sediment samples showed significant differences between the stations. Along the northern transect (Cape Finisterra) the seafloor sediments show an increase in grain size from the offshore to the coast. The offshore stations CA3 and CA2 revealed finer grained sediments, CA8 were composed of coarser sand and the station CA7, the shallowest station 77 m, presented the sediment composed mainly of shell fragments and coarse grain sand. Along the southern transect (Cape Roca), the offshore station CA6 (Fontanelas seamount) has coarser sandy sediments with rock clasts and cold-water coral fragments, and the stations CA5 and CA4 with fine sand to muddy sediments. The detailed CA6 bathymetry allowed to verify the existence of small plateaus on the slope of the Fontanelas seamount, where the fossil cold-water corals fragments were found, suggesting that this area is a very interesting system deserving further study with a ROV, and to characterize the corals fields and verify if there are live corals. These recollected data and samples will allow not only to reconstruct the pH variability under different environmental conditions, but also to estimate the biogeochemical changes along the coastal ocean waters as the anthropogenic influence increases. These results will contribute to better understand and model the effects on the biota under the future expected oceans pH changes.