 Metadata catalogue
Sea regions
Type of resources
Available actions
Topics
INSPIRE themes
Keywords
Contact for the resource
Provided by
Years
Formats
Representation types
Update frequencies
status
Service types
Scale
Resolution
-
-
The approach to the affection of the submarine noise in the North Atlantic Marine Subdivision has been made for a 5' x 5' grid, being the noise source navigation. To do this, a semi-quantitative index has been developed that integrates the analysis of AIS data (merchant vessels) and VMS data (fishing ships). For both, cells have been selected according to the intensity of traffic effects based on the density of AIS and VMS signals in a month. In both cases, different intensity intervals have been established, and each case has been given a different weight. In addition, adjacent cells have been selected (classified into four ranges), giving them another way of importance depending on the proximity. The zero range coincides with the cells in which the signal density was recorded, while the first range corresponds to those cells limiting with the zero level, and so on. In Table 10 and Table 11 of the aforementioned document the applied values are indicated. The final result is the addition of all the weights in each cell, taking into account the maximum value for the bordering cells. The values range between 0 and 3.1, with the following levels of classification: Very High: > 2 / High: 1.71 - 2 / Medium: 0.41 - 1.7 / Low: 0.1 - 0, 4 / Very Low < 0.1
-
Se han seleccionado zonas de potencial alto de entrada de patógenos a partir de las celdas clasificadas por el rango “Muy Alto” y zonas de potencial moderado de entrada de patógenos a partir de las celdas clasificadas por el rango “Alto” en el Mallado de Patógenos de la Demarcación marina del Estrecho y Alborán.
-

The Geographical Sub-Areas (GSAs) were established under the RES-GFCM/33/2009/2 - Establishment of Geographical Sub-Areas in the GFCM area amending the resolution GFCM/31/2007/2. The dataset only shows the GSA15 which is the GSA in which the Maltese Islands are found. For all the GSAs, one must refer to the legislation mentioned above or the following website: http://www.fao.org/gfcm/data/map-geographical-subareas/en/
-
Developed Coast within North Ayrshire as set out in the Local Development Plan
-
Isolated Coast within North Ayrshire as set out in the Local Development Plan
-
The impact of fishing on benthic habitats has previously been investigated however; a conclusive classification of potentially sensitive habitats per gear type does not exist. Currently only qualitative estimates of fishery impact using Broad-scale habitat maps are possible. Here a sensitivity matrix using both fishing pressure (fishing Intensity) and habitat sensitivity is employed to define habitat disturbance categories. The predominant fishing activities associated with physical abrasion of the seafloor area are from bottom contacting towed fishing gear. The swept area of the aforementioned gear in contact with the seabed is generally considered a function of gear width, vessel speed and fishing effort (ICES. 2015). The varying characteristics of fishing gear, their interaction with the sea floor and species being targeted; provide scope for differing interactions with subsurface (infaunal) and surface (epifaunal) dwelling communities. An evaluation of the abrasion pressure and habitat sensitivity split into surface and subsurface pressure allows greater insight to the ecological effects. Fishing intensity was calculated annually and based on the area of sea floor being swept (or swept area ratio SAR) by gear type. Calculations are based on SAR’s of gear types per area, per year. Fishing pressure ranks and habitat sensitivity ranks obtained from WGSFD working group (01 WGSFD - Report of the Working Group on Spatial Fisheries Data 2015) can be incorporated within a GIS environment to existing ICES fisheries data to provide habitat disturbance maps (fishing pressure maps+ habitat sensitivity maps) ICES. 2015. Report of the Working Group on Spatial Fisheries Data (WGSFD), 8–12 June 2015, ICES Headquarters, Copenhagen, Denmark. ICES CM 2015/SSGEPI:18. 150 pp.
-
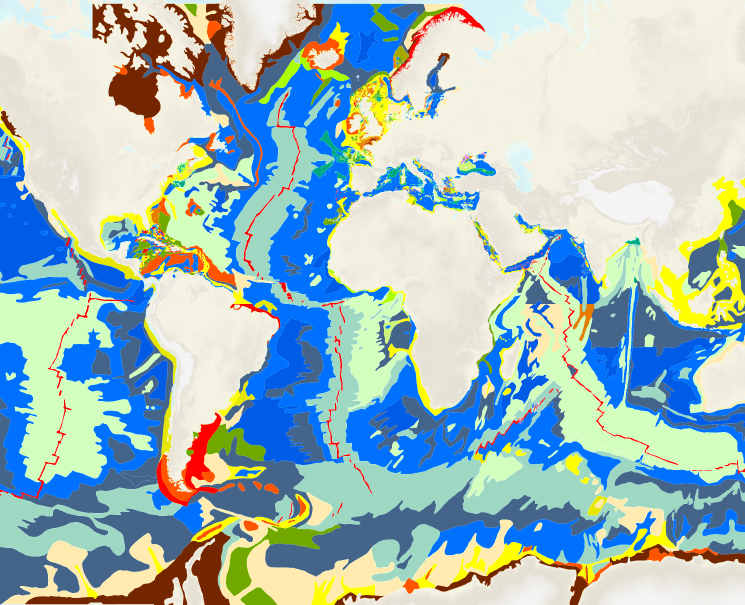
The “World Seabed Sediment Map” product contains geo-referenced digital data, describing the nature of the sediment encountered in different seas and oceans of the world. The objects are all surface areas and the description of an object includes in particular the nature of the sediment including rock-type bottoms.
-
Undeveloped Coast within North Ayrshire as set out in the Local Development Plan
-
These grid data were derived from National Parks and Wildlife Service cetacean surveys within the Irish MSFD area and the EEA-10km GRID. The grid shows the current distribution of Harbour seal (Phoca vitulina) and Grey seal (Halichoreus grypus) in Irish coastal and marine waters. The data were collected for the purposes of 2019 reporting under Article 17 of the EU Habitats Directive.