 Metadata catalogue
SIMAtlantic
Type of resources
Available actions
Topics
INSPIRE themes
Keywords
Contact for the resource
Provided by
Years
Formats
Representation types
Update frequencies
status
Service types
Scale
Resolution
-

The information gathered with the location of the best spots for the practice of nautical sports within the National Protected Areas Network. The sports considered in this dataset are the dive, surf, wind surf and kite surf.
-

Emodnet Human Activities - Major ports This facility provides free access to GIS data on European ports, with statistics on total shipped goods (TOnx1000; 2016) and passegers (exluded cruises; 2015/2016) Full information and statistics here http://www.emodnet-humanactivities.eu/search-results.php?dataname=Main+Ports Abstract The geodatabase on maritime transport in EU main ports includes goods, passengers and vessels traffic in the EU and was created in 2014 by Eurofish and Cogea for the European Marine Observation and Data Network (EMODnet). It is the result of the aggregation and harmonization of datasets provided to EUROSTAT by ports in EU Member States and Norway. EUROSTAT data have been related to GISCO's georeferenced ports. These datasets are updated on an annual basis where the most recent update includes annual data from 2014, 2015 and 2016 (where available). Goods and Passengers data are available from 2001 while vessel is maintained from 2006 onwards. Goods traffic data are reported in thousand tonnes by type of cargo and direction. Passengers traffic data are reported in thousand passengers (excluding cruise passengers) by direction and traffic type. Vessels traffic data are reported in unit and gross tonnage (thousand) of vessels by vessel size class and vessel type. Original data is reported quarterly by EUROSTAT, but has been aggregated on an annual basis to produce this dataset. Publication date 2017-05-03 Revision date 2017-03-17 Creation date 2014-05-01
-
Abstract from http://www.emodnet-humanactivities.eu/search-results.php?dataname=Telecommunication+Cables+%28schematic+routes%29 The dataset on submarine telecom cables was created by Cogea in 2014 for the European Marine Observation and Data Network. The underlying data is property of Telegeography and is available online at https://github.com/telegeography/www.submarinecablemap.com. Compared with the previous version, this version of includes the gigabit per second values that come from the Cable System Database of the Packet Clearing House organization and are available online at https://prefix.pch.net/applications/cablesystem/. The database contains lines and points representing cables and related landing points. Cables are represented as stylised paths, as actual cable routes locations are not available in most cases. The dataset includes any cable that crosses the EU waters (Marine regions). Marine regions and subregions boudaries are defined in Article 4 of the Marine Strategy Framework Directive (MSFD) and available online at https://www.eea.europa.eu/data-and-maps/data/msfd-regions-and-subregions. Citation Title EMODnet Human Activities: Telecom cables (schematic routes) Publication date 2014-08-24 Revision date 2016-07-07 Creation date 2014-07-31
-
Calcul des isolignes de la vitesse du vent avec une équidistance de 0.25 m/s
-
The approach to the affection of the submarine noise in the North Atlantic Marine Subdivision has been made for a 5' x 5' grid, being the noise source navigation. To do this, a semi-quantitative index has been developed that integrates the analysis of AIS data (merchant vessels) and VMS data (fishing ships). For both, cells have been selected according to the intensity of traffic effects based on the density of AIS and VMS signals in a month. In both cases, different intensity intervals have been established, and each case has been given a different weight. In addition, adjacent cells have been selected (classified into four ranges), giving them another way of importance depending on the proximity. The zero range coincides with the cells in which the signal density was recorded, while the first range corresponds to those cells limiting with the zero level, and so on. In Table 10 and Table 11 of the aforementioned document the applied values are indicated. The final result is the addition of all the weights in each cell, taking into account the maximum value for the bordering cells. The values range between 0 and 3.1, with the following levels of classification: Very High: > 2 / High: 1.71 - 2 / Medium: 0.41 - 1.7 / Low: 0.1 - 0, 4 / Very Low < 0.1
-
This data set represents the regions for level 1, 2 and 3 of the Nomenclature of Territorial Units for Statistics (NUTS) for 2013. The NUTS nomenclature is a hierarchical classification of statistical regions and subdivides the EU economic territory into regions of three different levels (NUTS 1, 2 and 3, respectively, moving from larger to smaller territorial units). NUTS 1 is the most aggregated level. The NUTS classification has been officially established through Regulation (EC) No 1059/2003 of the European Parliament and of the Council and amendments. A non official NUTS-like classification has been defined for the EFTA countries and candidate countries. An introduction to the NUTS classification is available here: http://epp.eurostat.ec.europa.eu/portal/page/portal/nuts_nomenclature/introduction This data set has been created mainly from the EuroBoundary Map v 8.x(Eurogeographics), geographic information from TurkStat for Turkey, the Global Administrative Unit Layer from FAO (UN) for Macedonia and a list of communes per statistical region provided by the countries. Available scales are 1M, 3M, 10M, 20M, 60M). Here six scale ranges (100K, 1M, 3M, 10M and 20M, 60M) are available. Coverage is the economical territory of the EU, EFTA countries and candidate countries as in 2013. This data has been generalised from 100K scale and therfore may not be an accurate depiction of the NUTS regions.
-
The geodatabase on aggregate extractions in the EU was created in 2014 by AZTI-Tecnalia for the European Marine Observation and Data Network (EMODnet). It is the result of the aggregation and harmonization of datasets provided by several sources from all across the EU. It is available for viewing and download on EMODnet - Human Activities web portal (www.emodnet-humanactivities.eu). The database contains points representing aggregate extraction sites, by year (although some data are indicated by a period of years), in the following countries: Belgium, Denmark, Finland, France, Germany, Ireland, Italy, Poland, Spain, Sweden, The Netherlands and United Kingdom. Where available, each point has the following attributes: Id (Identifier), Position Info (e.g.: Estimated, Original, Polygon centroid of dredging area, Estimated polygon centroid of dredging area), Country, Sea basin, Name of the extraction area, Area of activity (km2), Year (the year when the extraction took place), Permitted Amount (m3) (permitted amount of material to be extracted, in m3), Permitted Amount (t) (permitted amount of material to be extracted, in tonnes), Requested Amount (m3) (requested amount of material to be extracted, in m3), Requested Amount (t) (requested amount of material to be extracted, in tonnes), Extracted Amount (m3) (extracted amount of material, in m3), Extracted Amount (t) (extracted amount of material, in tonnes), Extraction Type (Marine sediment extraction), Purpose (e.g.: Commercial, Others, N/A), End Use (e.g.: Beach nourishment, Construction, Reclamation fill, N/A), Material type (e.g.: sand, gravel, maerl), Notes, Link to Web Sources.
-

-
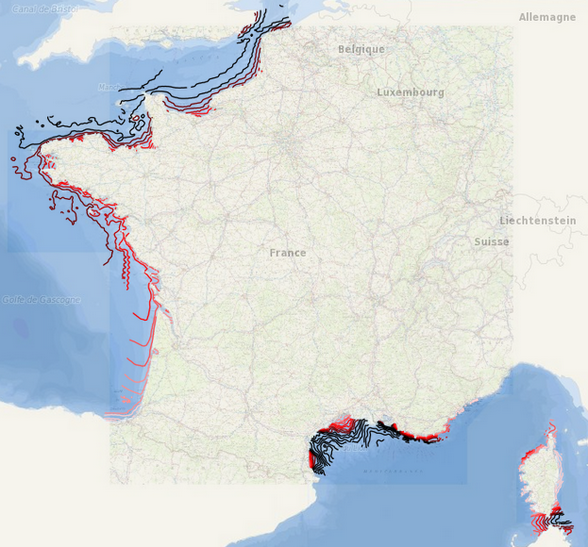
Représentation de l'indice de sensibilité morpho-sédimentaire ESI du littoral français. L'indice est produit à partir de la description de la nature morpho-sédimentaire du littoral ainsi que de l'appréciation de son niveau d'exposition à l'hydrodynamisme. La vulnérabilité des zones côtières aux dommages par hydrocarbures a été classée sur une échelle de 1 à 10. Pour simplifier la lecture des cartes, ces 10 classes ont été regroupées en 5 familles : ESI 1-2, ESI 3-4, ESI 5-6, ESI 7-8, ESI 9-10. Du fait des différences pouvant exister entre le bas et le haut de l'estran (identifié sous le terme "trait de côte" dans le cadre des Atlas POLMAR-Terre), la nature de l'estran et celle du trait de côte ont été cartographiées séparément. Cette couche représente l'indice de sensibilité morpho-sédimentaire du trait de côte du littoral français.
-
L'Indice de sensibilité environnementale du littoral français a été approché comme étant une approximation de la "valeur patrimoniale de l'environnement". La méthode retenue pour déterminer cet indice a consisté à comptabiliser sur un secteur donné le nombre de zones de protection environnementales se superposant, en partant du principe que plus un site va être couvert par des zonages différents plus il répond à un nombre d'enjeux importants et donc plus sa valeur patrimoniale est élevée et sa vulnérabilité à la pollution aux hydrocarbures est importante. Cette couche représente l'indice de sensibilité environnementale du littoral français réparti selon 5 classes d'indice allant du peu sensible au très sensible : 1- peu sensible, 2, 3-4, 5-6 et supérieure ou égale à 7 - très sensible.