 Metadata catalogue
OGC
Type of resources
Available actions
Keywords
Contact for the resource
Provided by
Years
Formats
status
Service types
-
Accès aux données de GéoLimousin par le service WMS.
-
Le service permet de télécharger les données raster mises à disposition par la région Bretagne.
-
Service de mise à disposition des données de l'application de signalement des changements d'adresse (sign'adresse). Le serveur utilisé est un Geoserver 2.8
-

Service de mise à disposition des données de la région Bretagne. Le serveur utilisé est un GeoServer 2.12.2.
-
Serveur wms public de l'Ifremer, Accès aux données du Sismer
-
Serveur wms du projet DCSMM
-

Satellite images are routinely processed to yield information on clouds properties. The Copernicus Atmosphere Monitoring Service (CAMS) offer access to properties of the cloudless atmosphere every 3h. These sets of information are combined together with site-specific properties, e.g. elevation and shadowing by local relief, to produce estimates of the solar radiation at a given site. Thus, the computation is made on an ad hoc basis on-the-fly. To better account for changes in solar position and possible shadowing effects, computations of the solar radiation are made every 1 min and the results are then aggregated e.g. every 15 min or 1 h, chosen by the user. The operations that are currently working satisfactorily though improvements should be brought to ease access to data by users. A new use case has arisen recently due to the large penetration of PV plants in Europe. Grid operators need a better knowledge of the very local production of electricity by PV plants that are connected to the grid in order to ensure the stability and quality of the electricity delivered to customers. Accordingly, their requests are for time-series of solar radiation over a regular grid of points covering their area of interest which may be nation-wide. Though the time-series may be short, e.g. two days of estimates every 15 min, the number of grid nodes may be high. An area of say 1000 km x 1000 km with a grid cell of 10 km in size means running the model for 10 000 nodes at the same time. The concept of cloud computing supporting the NexGEOSS infrastructure may help in solving this issue in both computational aspects and dissemination aspects.
-
Web Map Service for Emodnet Chemistry
-
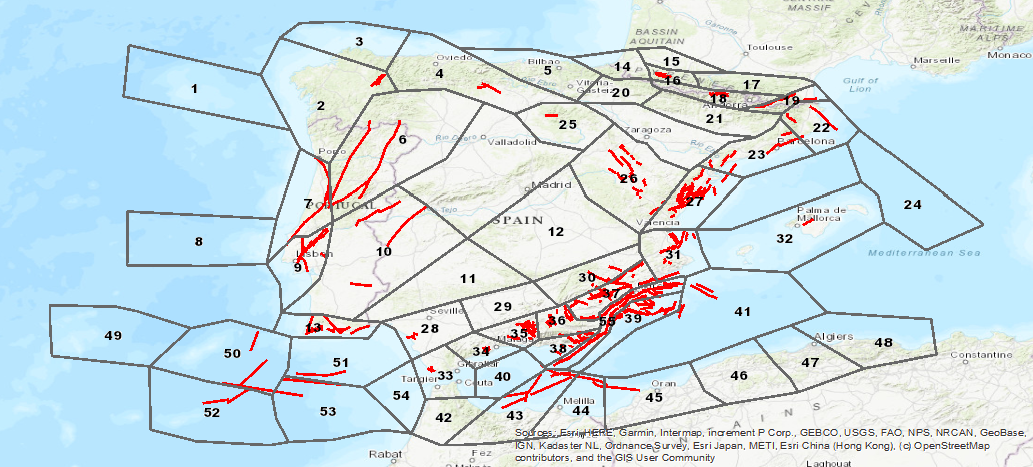
Database visualization service of seismogenic zones of the Iberian Peninsula and territories of influence for the calculation of seismic hazard in Spain (ZESIS)