 Metadata catalogue
Modelling data
Type of resources
Available actions
Topics
INSPIRE themes
Keywords
Contact for the resource
Provided by
Years
Formats
Representation types
Update frequencies
status
Scale
Resolution
-
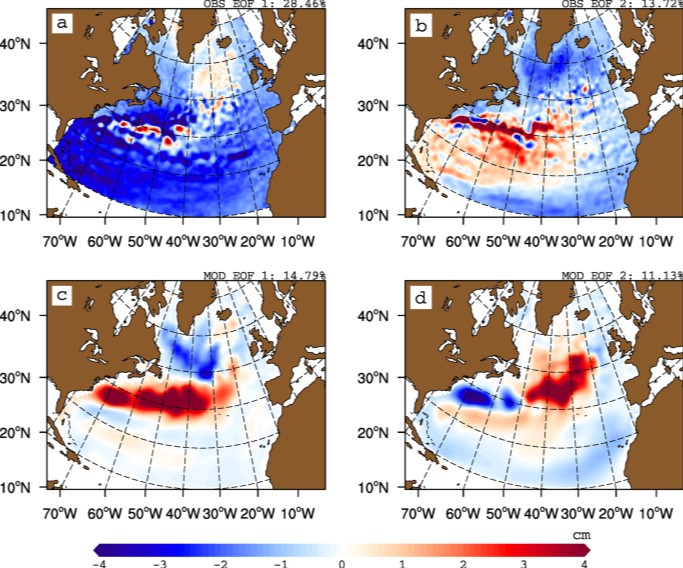
The gyre index constructed here from satellite altimetry is related to core aspects of the North Atlantic subpolar gyre, meridional overturning circulation, hydrographic properties in the Atlantic inflows toward the Arctic, and in marine ecosystems in the northeast Atlantic Ocean. The data series spans the period January 1993 to September 2018. Data description: Monthly gyre index from January 1993 until September 2018. The data is provided in one comma separated value (csv) file with the following entries on each row: year, month, index value. The index is normalized, i.e. it has a zero mean and unit standard deviation. Positive (negative) gyre index reflects stronger (weaker) than average surface circulation of the North Atlantic subpolar gyre.
-

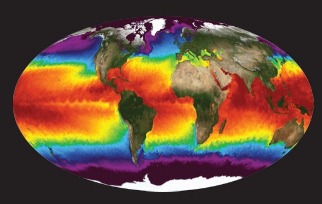
We assembled a dataset of 14C-based productivity measurements to understand the critical variables required for accurate assessment of daily depth-integrated phytoplankton carbon fixation (PP(PPeu)u) from measurements of sea surface pigment concentrations (Csat)(Csat). From this dataset, we developed a light-dependent, depth-resolved model for carbon fixation (VGPM) that partitions environmental factors affecting primary production into those that influence the relative vertical distribution of primary production (Pz)z) and those that control the optimal assimilation efficiency of the productivity profile (P(PBopt). The VGPM accounted for 79% of the observed variability in Pz and 86% of the variability in PPeu by using measured values of PBopt. Our results indicate that the accuracy of productivity algorithms in estimating PPeu is dependent primarily upon the ability to accurately represent variability in Pbopt. We developed a temperature-dependent Pbopt model that was used in conjunction with monthly climatological images of Csat sea surface temperature, and cloud-corrected estimates of surface irradiance to calculate a global annual phytoplankton carbon fixation (PPannu) rate of 43.5 Pg C yr‒1. The geographical distribution of PPannu was distinctly different than results from previous models. Our results illustrate the importance of focusing Pbopt model development on temporal and spatial, rather than the vertical, variability.
-
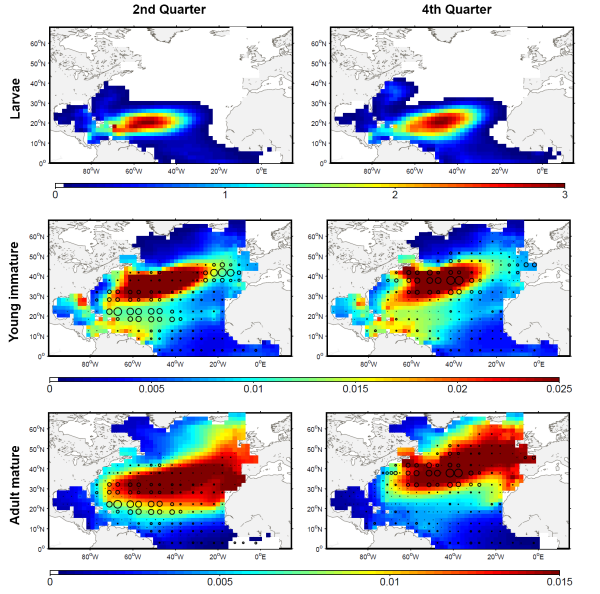
The development of the ecosystem approach and models for the management of ocean marine resources requires easy access to standard validated datasets of historical catch data for the main exploited species. They are used to measure the impact of biomass removal by fisheries and to evaluate the models skills, while the use of standard dataset facilitates models inter-comparison. North Atlantic albacore tuna is exploited all year round by longline and in summer and autumn by surface fisheries and fishery statistics compiled by the International Commission for the Conservation of Atlantic Tunas (ICCAT). Catch and effort with geographical coordinates at monthly spatial resolution of 1° or 5° squares were extracted for this species with a careful definition of fisheries and data screening. In total, thirteen fisheries were defined for the period 1956-2010, with fishing gears longline, troll, mid-water trawl and bait fishing. However, the spatialized catch effort data available in ICCAT database represent a fraction of the entire total catch. Length frequencies of catch were also extracted according to the definition of fisheries above for the period 1956-2010 with a quarterly temporal resolution and spatial resolutions varying from 1°x 1° to 10°x 20°. The resolution used to measure the fish also varies with size-bins of 1, 2 or 5 cm (Fork Length). The screening of data allowed detecting inconsistencies with a relatively large number of samples larger than 150 cm while all studies on the growth of albacore suggest that fish rarely grow up over 130 cm. Therefore, a threshold value of 130 cm has been arbitrarily fixed and all length frequency data above this value removed from the original data set.
-
NASA's Physical Oceanography Distributed Active Archive Center (PO.DAAC) is located at NASA's Jet Propulsion Laboratory in Pasadena, California. PO.DAAC manages and provides tools and services for NASA's oceanographic and hydrologic data (satellite, airborne, and in-situ) to enable a greater understanding of the physical processes and conditions of the global ocean. Measurements include gravity, ocean winds, sea surface temperature, ocean surface topography, sea surface salinity, and circulation. The data support a wide range of applications including climate research, weather prediction, resource management, policy, and the stewardship of ocean data resources.
-

'''DEFINITION''' Oligotrophic subtropical gyres are regions of the ocean with low levels of nutrients required for phytoplankton growth and low levels of surface chlorophyll-a whose concentration can be quantified through satellite observations. The gyre boundary has been defined using a threshold value of 0.15 mg m-3 chlorophyll for the Atlantic gyres (Aiken et al. 2016), and 0.07 mg m-3 for the Pacific gyres (Polovina et al. 2008). The area inside the gyres for each month is computed using monthly chlorophyll data from which the monthly climatology is subtracted to compute anomalies. A gap filling algorithm has been utilized to account for missing data inside the gyre. Trends in the area anomaly are then calculated for the entire study period (September 1997 to December 2020). '''CONTEXT''' Oligotrophic gyres of the oceans have been referred to as ocean deserts (Polovina et al. 2008). They are vast, covering approximately 50% of the Earth’s surface (Aiken et al. 2016). Despite low productivity, these regions contribute significantly to global productivity due to their immense size (McClain et al. 2004). Even modest changes in their size can have large impacts on a variety of global biogeochemical cycles and on trends in chlorophyll (Signorini et al 2015). Based on satellite data, Polovina et al. (2008) showed that the areas of subtropical gyres were expanding. The Ocean State Report (Sathyendranath et al. 2018) showed that the trends had reversed in the Pacific for the time segment from January 2007 to December 2016. '''CMEMS KEY FINDINGS''' The trend in the South Altantic gyre area for the 1997 Sept – 2020 December period was positive, with a 0.09% increase in area relative to 2000-01-01 values. Note that this trend is lower than the 0.13% rate for the 1997-2019 trend (though within the uncertainties associated with the two estimates) and is statistically significant (p<0.05). During the 1997 Sept – 2020 December period, the trend in chlorophyll concentration was positive (0.35% year-1) relative to 2000-01-01 values. This is a significant increase from the trend of 0.02% year-1 for the 1997-2019 period. '''DOI (product):''' https://doi.org/10.48670/moi-00228
-
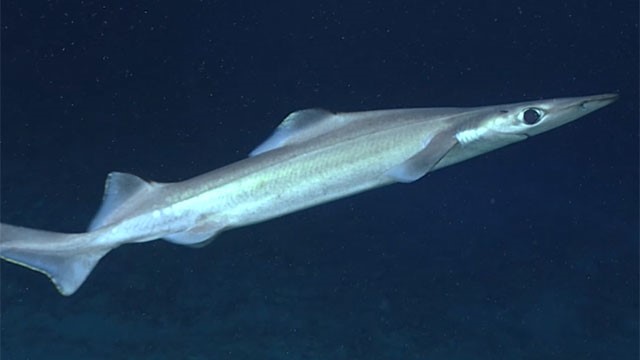
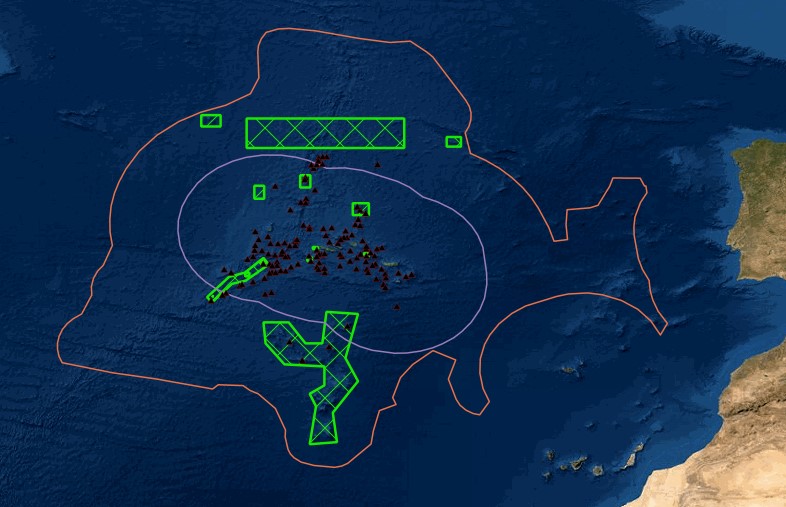
We developed predictive distribution models of deep-sea elasmobranchs for up to 2000 m depth in the Azores EEZ and neighboring seamounts, from approximately 33°N to 43°N and 20°W to 36°W. Georeferenced presence, absence, and abundance data were obtained from scientific surveys and commercial operations reporting at least one deep-sea elasmobranch capture. A 20-year 'survey dataset' (1996-2017) was compiled from annual scientific demersal surveys using two types of bottom longlines (types LLA and LLB), and an 'observer dataset' (2004-2018) from observer programs covering commercial fisheries operations using bottom longline (similar to type LLA) and vertical handline ('gorazeira').
-

Morphological map (10 classes) of the Irish shelf resulting from the modal aggregation (Cell statistics “MAJORITY” in ArcGIS Pro 3.1) of the qualitatively and quantitatively best Fully Convolutional Neural Networks models obtained in the study: Arosio, R., Hobley, B., Wheeler, A. J., Sacchetti, F., Conti, L. A., Furey, T. and A. Lim, 2023. Fully convolutional neural networks applied to large-scale marine morphology mapping. Frontiers in Marine Science, Sec. Ocean Observation, 10, https://doi.org/10.3389/fmars.2023.1228867.
-
'''Short description: ''' For the '''Global''' Ocean '''Satellite Observations''', ACRI-ST company (Sophia Antipolis, France) is providing '''Chlorophyll-a''' and '''Optics''' products [1997 - present] based on the '''Copernicus-GlobColour''' processor. * '''Chlorophyll and Bio''' products refer to Chlorophyll-a, Primary Production (PP) and Phytoplankton Functional types (PFT). Products are based on a multi sensors/algorithms approach to provide to end-users the best estimate. Two dailies Chlorophyll-a products are distributed: ** one limited to the daily observations (called L3), ** the other based on a space-time interpolation: the '''"Cloud Free"''' (called L4). * '''Optics''' products refer to Reflectance (RRS), Suspended Matter (SPM), Particulate Backscattering (BBP), Secchi Transparency Depth (ZSD), Diffuse Attenuation (KD490) and Absorption Coef. (ADG/CDM). * The spatial resolution is 4 km. For Chlorophyll, a 1 km over the Atlantic (46°W-13°E , 20°N-66°N) is also available for the '''Cloud Free''' product, plus a 300m Global coastal product (OLCI S3A & S3B merged). *Products (Daily, Monthly and Climatology) are based on the merging of the sensors SeaWiFS, MODIS, MERIS, VIIRS-SNPP&JPSS1, OLCI-S3A&S3B. Additional products using only OLCI upstreams are also delivered. * Recent products are organized in datasets called NRT (Near Real Time) and long time-series in datasets called REP/MY (Multi-Years). The NRT products are provided one day after satellite acquisition and updated a few days after in Delayed Time (DT) to provide a better quality. An uncertainty is given at pixel level for all products. To find the '''Copernicus-GlobColour''' products in the catalogue, use the search keyword '''"GlobColour"'''. See [http://catalogue.marine.copernicus.eu/documents/QUID/CMEMS-OC-QUID-009-030-032-033-037-081-082-083-085-086-098.pdf QUID document] for a detailed description and assessment. '''DOI (product) :''' https://doi.org/10.48670/moi-00100
-
Portal of Maritime Spatial Planning of the Azores which hosts several GIS layers, such as: - Fishing areas and aquaculture production areas - Bathymetry - Mineral resources: Deep seabed polymetallic nodules - Hydrothermal vents - Distribution of seamount extracted, 2008 - Seafloor geomorphologic classification - Ocean environmental variables mean between the years 2002 and 2013: Sea Surface Temperature, Chlorophyll-a Concentration, Particulate Organic Carbon and Particulate Inorganic Carbon, Photosynthetically, Available Radiation, Ocean Productivity - Maerl habitats - Predictive distribution modelling for 26 cold-water coral species - Coldwater corals - Legal issues - Infrastructure and equipment - Underwater cultural heritage - Aggregate extraction - Tourist maritime activities