 Metadata catalogue
MISSION ATLANTIC Results
Type of resources
Available actions
Topics
INSPIRE themes
Keywords
Contact for the resource
Provided by
Years
Formats
Representation types
Scale
Resolution
-
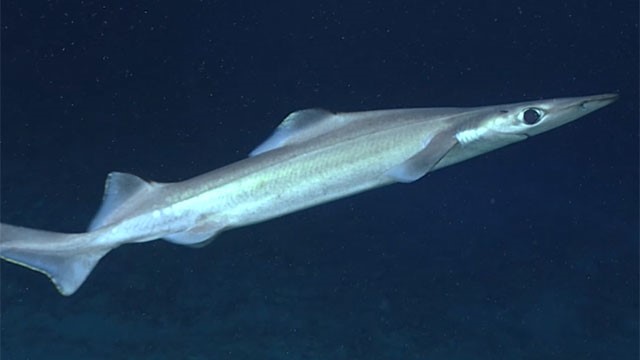
We developed predictive distribution models of deep-sea elasmobranchs for up to 2000 m depth in the Azores EEZ and neighboring seamounts, from approximately 33°N to 43°N and 20°W to 36°W. Georeferenced presence, absence, and abundance data were obtained from scientific surveys and commercial operations reporting at least one deep-sea elasmobranch capture. A 20-year 'survey dataset' (1996-2017) was compiled from annual scientific demersal surveys using two types of bottom longlines (types LLA and LLB), and an 'observer dataset' (2004-2018) from observer programs covering commercial fisheries operations using bottom longline (similar to type LLA) and vertical handline ('gorazeira').
-

Morphological map (10 classes) of the Irish shelf resulting from the modal aggregation (Cell statistics “MAJORITY” in ArcGIS Pro 3.1) of the qualitatively and quantitatively best Fully Convolutional Neural Networks models obtained in the study: Arosio, R., Hobley, B., Wheeler, A. J., Sacchetti, F., Conti, L. A., Furey, T. and A. Lim, 2023. Fully convolutional neural networks applied to large-scale marine morphology mapping. Frontiers in Marine Science, Sec. Ocean Observation, 10, https://doi.org/10.3389/fmars.2023.1228867.
-

3-D habitat suitability maps (HSM) or probability of occurrence maps, built using Shape-Constrained Generalized Additive Models (SC-GAMs) for the 30 main commercial species of the Atlantic region. Predictor variables for each species were selected from: sea water temperature, salinity, nitrate, net primary productivity, distance to seafloor, distance to coast, and relative position to mixed layer depth. Each species HSM contains 47 maps, one per depth level from 0 to 1000 m. Probability values of each map range from 0 (unsuitable habitat) to 1 (optimal habitat). For depth levels below the 0.99 quantile of the depth values found on the species occurrence data, NA values were assigned. Maps have been masked to species native range regions. See Valle et al. (2024) in Ecological Modelling 490:110632 (https://doi.org/10.1016/j.ecolmodel.2024.110632 ), for more details.