 Metadata catalogue
Europa
Type of resources
Available actions
Topics
INSPIRE themes
Keywords
Contact for the resource
Provided by
Years
Formats
Representation types
status
Service types
Scale
Resolution
-
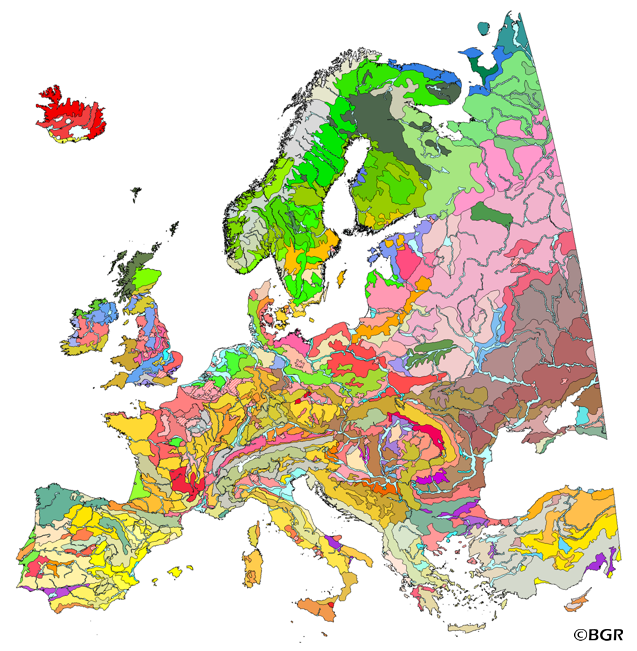
The 1:5 Million International Geological Map of Europe and Adjacent Areas shows the pre-Quarternary geology of Europe onshore and offshore. In addition to the geology attributed by age, petrography and genesis, also magnetic anomalies, tectonic structures, metamorphism and – in the offshore areas – information about the continental/oceanic crust and the continental margin, are shown. The map was developed by BGR under the umbrella of the Commission of the Geological Map of the World (CGMW) and in cooperation with geological surveys organisations of 48 countries and more than 20 research institutes. For detailed information about the 'IGME 5000: More than just a map – A multinational GIS Project' please visit the IGME website.
-
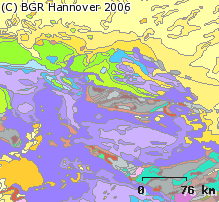
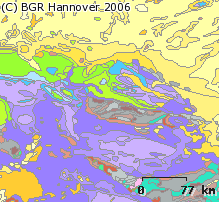
The map of the "Soil Regions of the European Union and Adjacent Countries 1:5,000,000 (Version 2.0)" is published by the Federal Institute of Geosciences and Natural Resources (BGR), in partnership with the Joint Research Center (JRC, Ispra). The soil regions map is intended to support the current national mapping activities towards a European 1:250,000 datbase by stratifying similar regional soil associations into a hierarchical concept. Only by stratification, the complexity of soils can be systematically structured so that the complex 1:250,000 legend can be handled in cross-national and contintental-level applications. Soil regions are natural, cross-regional soil geographical units which perform the highest spatial and content-based aggregation of European soils. They represent the frame conditions for soil development at the landscape level. The soil regions are presented at scale 1:5,000,000. Thus, its borders are highly generalized. Because of its low resolution, the map units absorb atypical soils and associations of soils, which are only described in higher resolution soil maps. The delineation of the soil regions is expected to be refined (and probably improved by its content) during the actual 1:250,000 mapping process. Thus, updating can be expected in the future. Currently, the soil regions map is the only graphical soil representation in Europe which has been developed using fully comparable and harmonized basic data at the continental level (climate, hydrography, relief, geology, vegetation): the interpretation of this input data, and the utilization of expert knowledge (including the interpretation of regional soil maps) has been done using one common methodology, developed and applied consistently throughout the whole mapping area by an experienced international soil mapper (Dr. Reinhard Hartwich, former member of BGR, and co-author of the 1998 Manual of Procedures). The methodology is extensively described in the Explanatory Notes (German), and in the revised Manual of Procedures which is expected to be completed soon. It is highly recommended to apply and interpret the map using the map comments and descriptions as provided in the explanatory notes (German: Hartwich et al. 2005; English: revision of the Manual of Procedures, initial version: Finke et al. 2001).
-
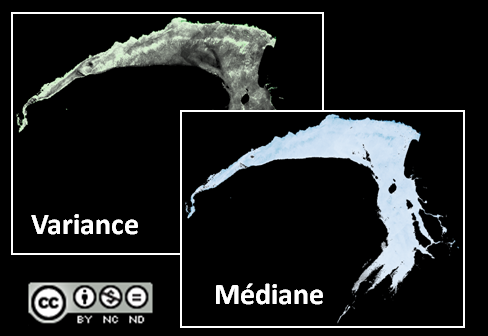
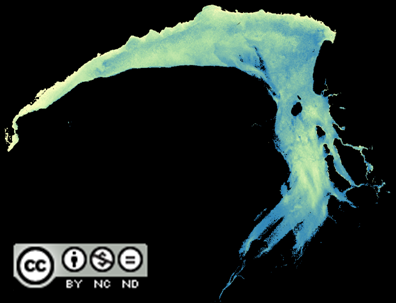
Des indices topographiques liés aux reliefs des fonds ont pu être extraits de la bathymétrie hyperspectrales sur les zones de mangrove d'Europa. Dans cette zone de mangrove, où les reliefs sous-marins sont faibles, seuls les deux indices topographiques IPM (Indice de rugosité), et IPV (Indice de variance du relief) ont été calculés. Ils permettent d'identifier les zones où les conditions sont considérées comme favorables à la présence des tortues. Cette hypothèse a été émise à partir de l’analyse des données sur La Réunion (programme CHARC), elle pourra être ou non confirmée par la suite lors de l’analyse des données de localisation des tortues. Les indices ICM (Idice de concavité) et ITT (Indice Tortues Topographique), non pertinents ici, n'ont pas été calculés. Le projet pIoT est co-financé par le Consortium Iles Éparses2017-2020, l'Ifremer (porteur) et ses partenaires (CNRS-LIRMM, KELONIA et CEDTM).
-
Les images hyperspectrales acquises en 2009 pour le projet Litto3D Océan Indien (IGN / SHOM) et sur financement de l'Agence des Aires Marines Protégées (AAMP). Les méthodes de calcul se basent sur les développements initiés dans le cadre de la convention de coopération quadripartite portant sur la "Cartographie Récifale des Îles Françaises de l'Ocean Indien à Partir de Données Hyperspectrales" entre La Préfecture de La Réunion, les Terres Australes et Antarctiques Françaises, l'AAMP et l'Ifremer. La combinaison des traitements de ces images hyperspectrales dans le cadre des projets pIoT (pilot project for Indian Ocean sea Turtles) d'une part et les données LIDAR à haute résolution (40 cm) sur les plateformes récifale d'autre part, a permis de générer un MNT à haute résolution sur la mangrove d'Europa, comblant certains vides dans les données et améliorant localement la résolution. Le projet pIoT est co-financé par le Consortium Iles Éparses2017-2020, l'Ifremer (porteur) et ses partenaires (CNRS-LIRMM, KELONIA et CEDTM).
-
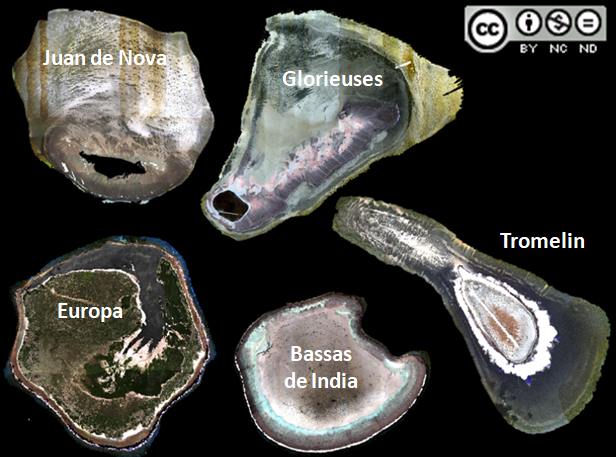
Ces images des fonds marins sont issues de la correction de la colonne d’eau sur les données hyperspectrales acquises en 2009 et en 2010 pour le projet Litto3D Océan Indien (IGN / SHOM) et sur financement de l'Agence des Aires Marines Protégées (AAMP). Les méthodes de calcul se basent sur les développements initiés dans le cadre de la convention de coopération quadripartite portant sur la "Cartographie Récifale des Îles Françaises de l'Ocean Indien à Partir de Données Hyperspectrales" entre La Préfecture de La Réunion, les Terres Australes et Antarctiques Françaises, l'AAMP et l'Ifremer. Le traitement en 2019 et 2020 de ces images dans le cadre des projets pIoT et IoT ((pilot) project for Indian Ocean sea Turtles) a permis de générer une composition colorée Rouge/Vert/Bleu telle qu’elle serait après retrait théorique de la colonne d’eau. Sur Glorieuses, ces traitements reprennent le travail initié dans le cadre du projet COPRA sur la Cartographie des herbiers à Thalassodendron (AFB / Marex). Le projet pIoT est co-financé par le Consortium Iles Éparses2017-2020, l'Ifremer (porteur) et ses partenaires (CNRS-LIRMM, KELONIA et CEDTM). Le projet IoT est co-financé par le FEDER-INTERREG V OI, l'Etat, l'Ifremer (porteur) et ses partenaires (CNRS-LIRMM, Terres Australes et Antartiques Françaises, Conseil Départemental de Mayotte,Parc Naturel Marin de Mayotte, association Oulanga Na Nyamba de Mayotte et Seychelles Islands Foundation).
-
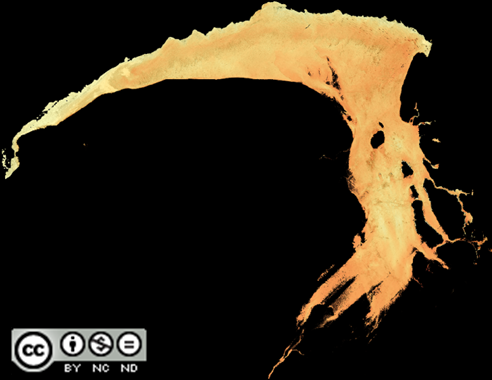
Cette représentation des reliefs des fonds est issue de la combinaison du MNT Bathymétrique des mangroves de l'île d'Europa, issu du traitement des données hyperspectrales avec une extrapolation des pentes (niveaux de gris) à l'échelle de la résolution de l'image. Il permet de générer une couche d'information révélant de nombreux détails de la géomorphologie des récifs. Les images hyperspectrales acquises en 2009 pour le projet Litto3D Océan Indien (IGN / SHOM) et sur financement de l'Agence des Aires Marines Protégées (AAMP). Les méthodes de calcul se basent sur les développements initiés dans le cadre de la convention de coopération quadripartite portant sur la "Cartographie Récifale des Îles Françaises de l'Ocean Indien à Partir de Données Hyperspectrales" entre La Préfecture de La Réunion, les Terres australes et antarctiques françaises (Taaf), l'AAMP et l'Ifremer. Le projet pIoT est co-financé par le Consortium Iles Éparses2017-2020, l'Ifremer (porteur) et ses partenaires (CNRS-LIRMM, KELONIA et CEDTM).
-
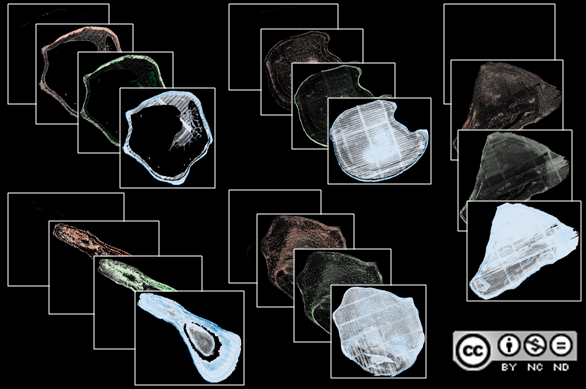
Des indices topographiques liés aux reliefs des fonds ont pu être extraits de la bathymétrie Lidar Litto 3D des îles d'Europa (projet PIoT), Tromelin, Bassas de India, Glorieuses et Juan de Nova (projet IoT) Le produit des 3 indices topographiques IPM (Indice de rugosité), IPV (Indice de variance du relief) et ICM (Idice de concavité) pour le calcul de l’ITT (Indice Tortues Topographique), permet de ne conserver que les zones où toutes les valeurs sont fortes, masquant les secteurs où au moins l’un des facteurs se rapproche de zéro. Il faut que les trois paramètres (pente, variance de pente et concavité) soient proches de leur optimal pour que les conditions soient considérées comme favorables à la présence des tortues. Cette hypothèse a été émise à partir de l’analyse des données sur La Réunion (programme CHARC), elle pourra être ou non confirmée par la suite lors de l’analyse des données de localisation des tortues. Le MNT Lidar produit dans le cadre de Litto3D® a été acquis en 2009-2010. Le projet pIoT est co-financé par le Consortium Iles Éparses2017-2020, l'Ifremer (porteur) et ses partenaires (CNRS-LIRMM, KELONIA et CEDTM). Le projet IoT est co-financé par le FEDER-INTERREG V OI, l'Etat, l'Ifremer (porteur) et ses partenaires (CNRS-LIRMM, Terres Australes et Antartiques Françaises, Conseil Départemental de Mayotte,Parc Naturel Marin de Mayotte, association Oulanga Na Nyamba de Mayotte et Seychelles Islands Foundation).
-
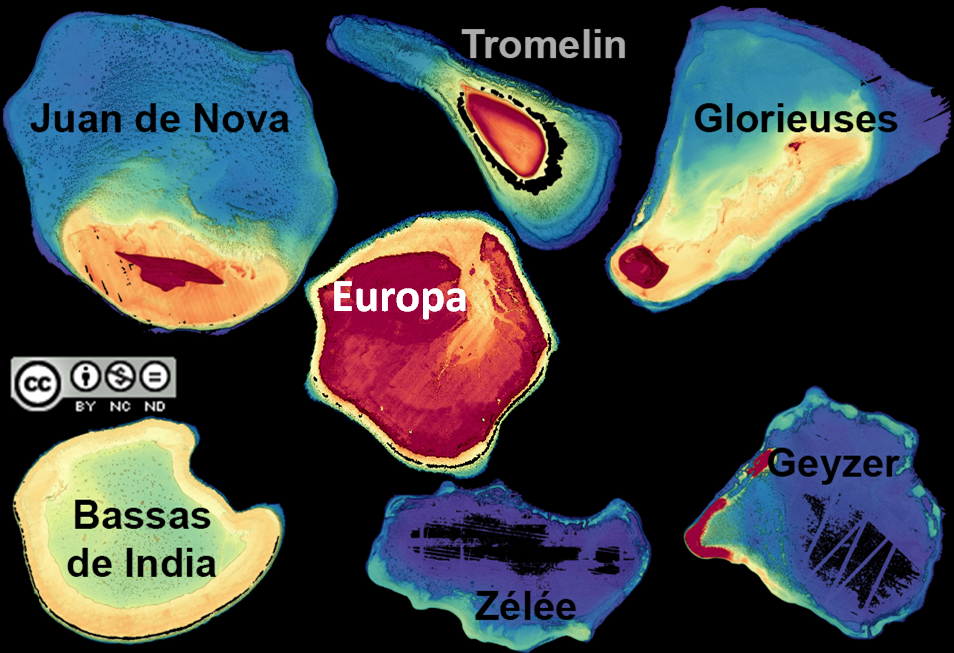
Cette représentation des reliefs des fonds est issue de la combinaison du MNT Bathymétrique Lidar Litto 3D des îles d'Europa (projet PIoT), Tromelin, Bassas de India, Glorieuses, Juan de Nova, Geyser et Zélée (projet IoT) avec une extrapolation des pentes (niveaux de gris) à l'échelle de la résolution de l'image. Il permet de générer une couche d'information révélant de nombreux détails de la géomorphologie des récifs. Le MNT Lidar produit dans le cadre de Litto3D® a été acquis en 2009-2010 (images haute altitude). Le projet pIoTest co-financé par le Consortium Iles Éparses et les Terres Australes et Antartiques Françaises. Le projet pIoT est co-financé par le Consortium Iles Éparses2017-2020, l'Ifremer (porteur) et ses partenaires (CNRS-LIRMM, KELONIA et CEDTM). Le projet IoT est co-financé par le FEDER-INTERREG V OI, l'Etat, l'Ifremer (porteur) et ses partenaires (CNRS-LIRMM, Terres Australes et Antartiques Françaises, Conseil Départemental de Mayotte,Parc Naturel Marin de Mayotte, association Oulanga Na Nyamba de Mayotte et Seychelles Islands Foundation).