 Metadata catalogue
Data
Type of resources
Available actions
Topics
INSPIRE themes
Keywords
Contact for the resource
Provided by
Years
Formats
Representation types
Update frequencies
status
Service types
Scale
Resolution
-
This service provides an Atom feed of datasets that are available for download.
-
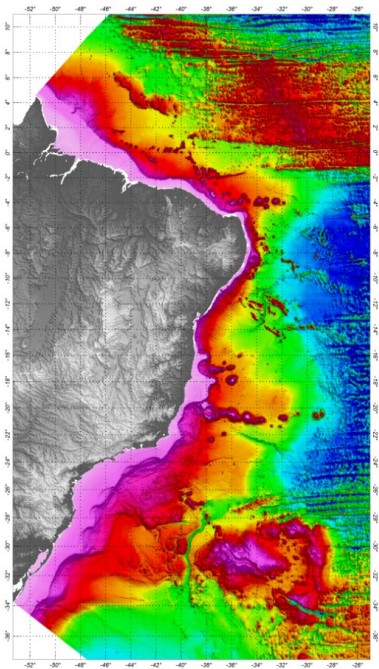
The Digital Terrain Model was developed based on all available bathymetric data, already processed and validated. The SRTM30_PLUS (Shuttle Radar Topography Mission) data were used just to complement the bathymetric grid in distal regions of the Brazilian Continental Margin. In order to prepare the bathymetric grid from a database composed by all qualified bathymetric information, it was adopted the Randgrid.GX/Geosoft - Oasis Montaj®, version 9.5.2, routine. The used mathematical model creates a surface of minimum curvature, using a similar method to that proposed by Swain (1976) and Briggs (1974), with the interpolation, in each knot of the grid, of X and Y values in metric coordinates and Z values (variable). The calculated surface adjusts itself to the irregularly sampled original values. The grid cell-size was 1,000 m, defined according the spatial distribution of the available data. The Brazilian DTM Oasis grid file was converted to surfer files, Versions V6 and V7. The ASCII file and a Geotif image were also provided. The reference system and geodetic datum adopted for the bathymetric data was the WGS84. The projection adopted was the World Mercator (false N=0, false E=0, latitude of the natural origin=0 longitude of the natural origin=0, and the scaling factor of the natural origin=1).
-
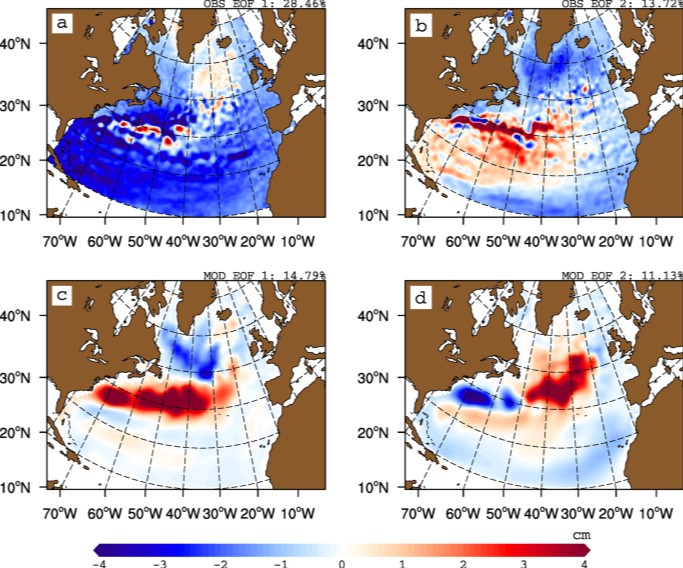
The gyre index constructed here from satellite altimetry is related to core aspects of the North Atlantic subpolar gyre, meridional overturning circulation, hydrographic properties in the Atlantic inflows toward the Arctic, and in marine ecosystems in the northeast Atlantic Ocean. The data series spans the period January 1993 to September 2018. Data description: Monthly gyre index from January 1993 until September 2018. The data is provided in one comma separated value (csv) file with the following entries on each row: year, month, index value. The index is normalized, i.e. it has a zero mean and unit standard deviation. Positive (negative) gyre index reflects stronger (weaker) than average surface circulation of the North Atlantic subpolar gyre.
-
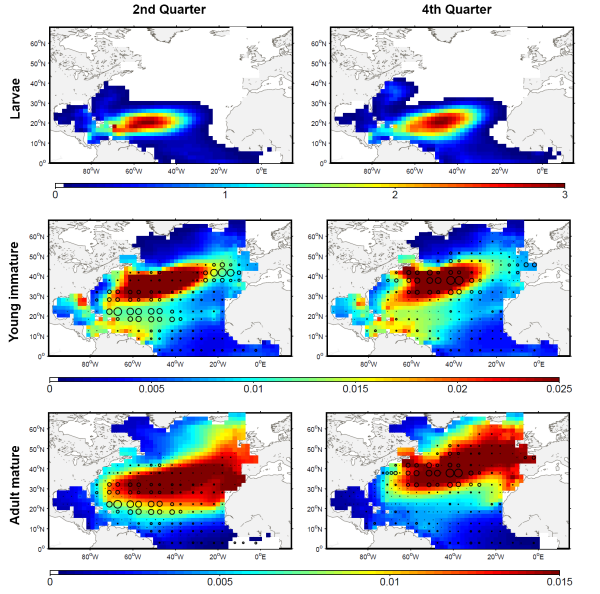
The development of the ecosystem approach and models for the management of ocean marine resources requires easy access to standard validated datasets of historical catch data for the main exploited species. They are used to measure the impact of biomass removal by fisheries and to evaluate the models skills, while the use of standard dataset facilitates models inter-comparison. North Atlantic albacore tuna is exploited all year round by longline and in summer and autumn by surface fisheries and fishery statistics compiled by the International Commission for the Conservation of Atlantic Tunas (ICCAT). Catch and effort with geographical coordinates at monthly spatial resolution of 1° or 5° squares were extracted for this species with a careful definition of fisheries and data screening. In total, thirteen fisheries were defined for the period 1956-2010, with fishing gears longline, troll, mid-water trawl and bait fishing. However, the spatialized catch effort data available in ICCAT database represent a fraction of the entire total catch. Length frequencies of catch were also extracted according to the definition of fisheries above for the period 1956-2010 with a quarterly temporal resolution and spatial resolutions varying from 1°x 1° to 10°x 20°. The resolution used to measure the fish also varies with size-bins of 1, 2 or 5 cm (Fork Length). The screening of data allowed detecting inconsistencies with a relatively large number of samples larger than 150 cm while all studies on the growth of albacore suggest that fish rarely grow up over 130 cm. Therefore, a threshold value of 130 cm has been arbitrarily fixed and all length frequency data above this value removed from the original data set.
-
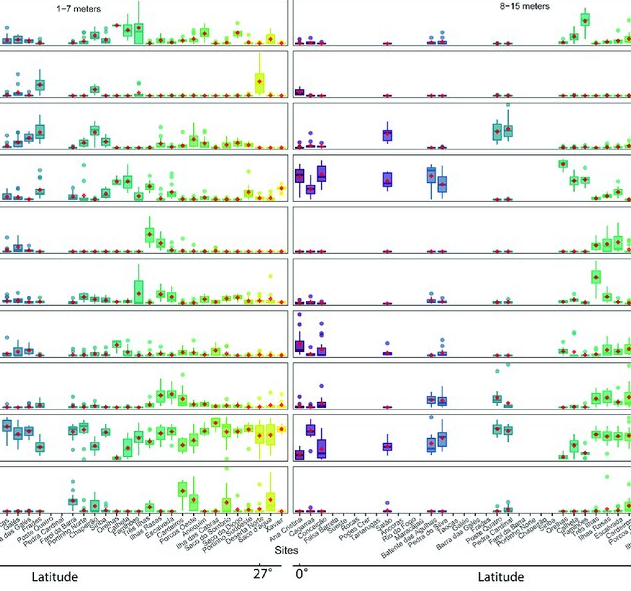
As marine ecosystems are influenced by global and regional processes, standardized information on community structure has become crucial for assessing broad-scale responses to natural and anthropogenic disturbances. Extensive biogeographic provinces, such as the Brazilian Province in the southwest Atlantic, present numerous theoretical and methodological challenges for understanding community patterns on a macroecological scale. In particular, the Brazilian Province is composed of a complex system of heterogeneous reefs and a few offshore islands, with contrasting histories and geophysical-chemical environments. Despite the large extent of the Brazilian Province (almost 8,000 kilometers), most studies of shallow benthic communities are qualitative surveys and/or have been geographically restricted. We quantified community structure of shallow reef habitats from 0° to 27°S latitude using a standard photographic quadrat technique. Percent cover data indicated that benthic communities of Brazilian reefs were dominated by algal turfs and frondose macroalgae, with low percent cover of reef-building corals. Community composition differed significantly among localities, mostly because of their macroalgal abundance, despite reef type or geographic region, with no evident latitudinal pattern. Benthic diversity was lower in the tropics, contrary to the general latitudinal diversity gradient pattern. Richness peaked at mid-latitudes, between 20°S to 23°S, where it was ~3.5-fold higher than localities with the lowest richness. This study provides the first large-scale description of benthic communities along the southwestern Atlantic, providing a baseline for macroecological comparisons and evaluation of future impacts. Moreover, the new understanding of richness distribution along Brazilian reefs will contribute to conservation planning efforts, such as management strategies and the spatial prioritization for the creation of new marine protected areas.
-
This service is an INSPIRE download WFS service, providing UK onshore bedrock geological data at 1:625 000 scale. This map data is collected as part of an ongoing BGS project: Digital Geological Map of Great Britain (DiGMapGB). GeoServer software is used to provide this WFS service. This service is delivering MappedFeatures specified by GeologicUnits, the geological history of which is recorded by GeologicEvents.
-
The 1:50 000 scale GeoSure (natural ground stability) data covering the map sheets for Loughborough and Kilmarnock are available in this OGC WMS service for personal, non-commercial use only. This service is a contribution to the OneGeology-Europe initiative. For information about more of the British Geological Survey's maps and other digital products please visit http://www.bgs.ac.uk/products. MapServer software is used to provide this OGC WMS service.
-
This service is the BGS contribution to the OneGeology project, providing UK onshore geological data at 1:625 000 scale and UK continental shelf seabed sediment data at 1:1 million scale. This map data is collected as part of an ongoing BGS project: Digital Geological Map of Great Britain (DiGMapGB). MapServer software is used to provide these OGC WMS and WFS services.
-
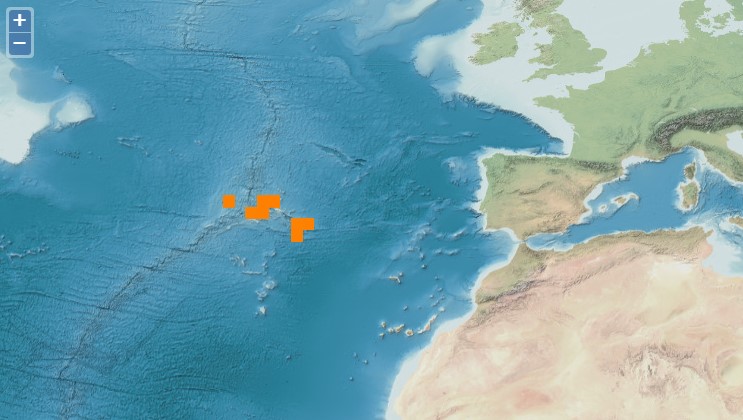
Fish assemblages surveyed by using underwater visual censuses (UVC) down to 40 m. Transects were performed between 1997 and 2015 in the Azores, Portugal. All mobile fish were identified to the lowest possible taxon. Dates, geographic coordinates and species recorded are provided. Fish assemblages were surveyed using underwater visual censuses (UVC) down to 40 m. Following standard belt transect surveys (Brock 1954), SCUBA divers sampled transects with 50 m length and 5 m width. All mobile fish were identified to the lowest possible taxon and counted. Sampling sites were chosen based on the general representativeness of the habitat. Transects within sites were selected by stratified random sampling: different transects were done in each dive without replicating the depth strata (every 10 m) or overall bottom type or crossing transects during a single dive or day. UVCs were conducted in the scope of projects CLIPE (FCT—Praxis XXI/3/3.2/EMG/1957/95), MARÉ (LIFE B4-3200/98-509), MAREFISH (FCT-POCTI/ BSE/41207/2001), OGAMP (INTERREG IIIb/MAC/4.2/A2 2001), MARMAC (INTERREGIIIb-03/MAC/4.2/A1 2004), EmpaFish (EC-FP6, SSP8-006539), MareFish (FCT, POCTI/BSE/41207/2001), MoniZEC (FRC - M2.1.2/I/018/2011)
-
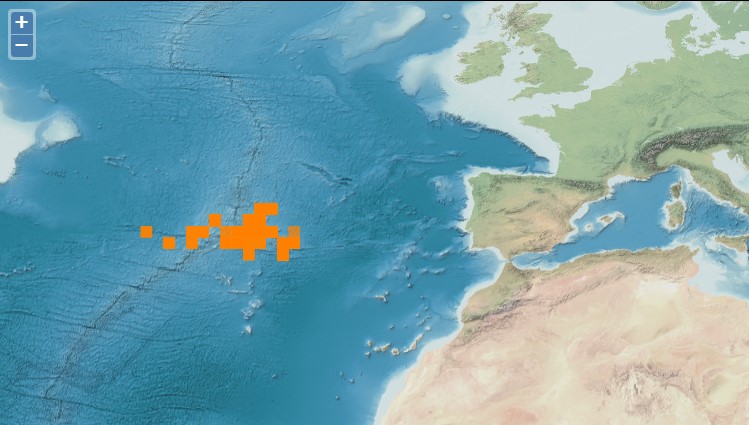
Demersal surveys performed with bottom longline during research cruises around Azorean islands and several seamounts. Surveys conducted annually (few exceptions) from 1996 to 2013. Sampling is performed using a "stone-buoy longline" similar to the one used in the commercial demersal fishery in the Azores. The sampling is stratified and random based on depth and geographic areas from 25 meters to 1200 meters mostly, but few sets down to 2000 meters. In some sets a different longline design was used (see Menezes et al. 2009). Soak time was usually 2 to 3 hours, but deeper sets (below 1000 meters) have longer soaks times. Chopped and salted sardines were used as bait.