 Metadata catalogue
/Processed data/Composite products
Type of resources
Available actions
Topics
INSPIRE themes
Keywords
Provided by
Representation types
Update frequencies
status
Scale
-

The Ocean Heat Content ("OHC") is estimated from the measurement of the thermal expansion of the ocean based on differences between the total sea-level content derived from altimetry measurements and the mass content derived from gravimetry data, noted “altimetry-gravimetry”. The Earth Energy Imbalance ("EEI") indicator is derived from the temporal variations of the ocean heat content, i.e. by calculating its derivative (called the ocean heat uptake). A single NetCDF file provides all variables, including all data used to calculate the Ocean Heat Content and the Earth Energy Imbalance indicators, delivered transparently and allowing users to reconstruct their own Ocean Heat Content or Earth Energy Imbalance indicators. Users will therefore be able to find, among other things : - the regional map of the Ocean Heat Content trends (3°x3°) (see image associated with this metadata sheet) - global ocean heat content time series (representative of the globe within the extent of data availability) - earth energy imbalance time series (from global OHC filtered-out from signals lower than 3 years)
-
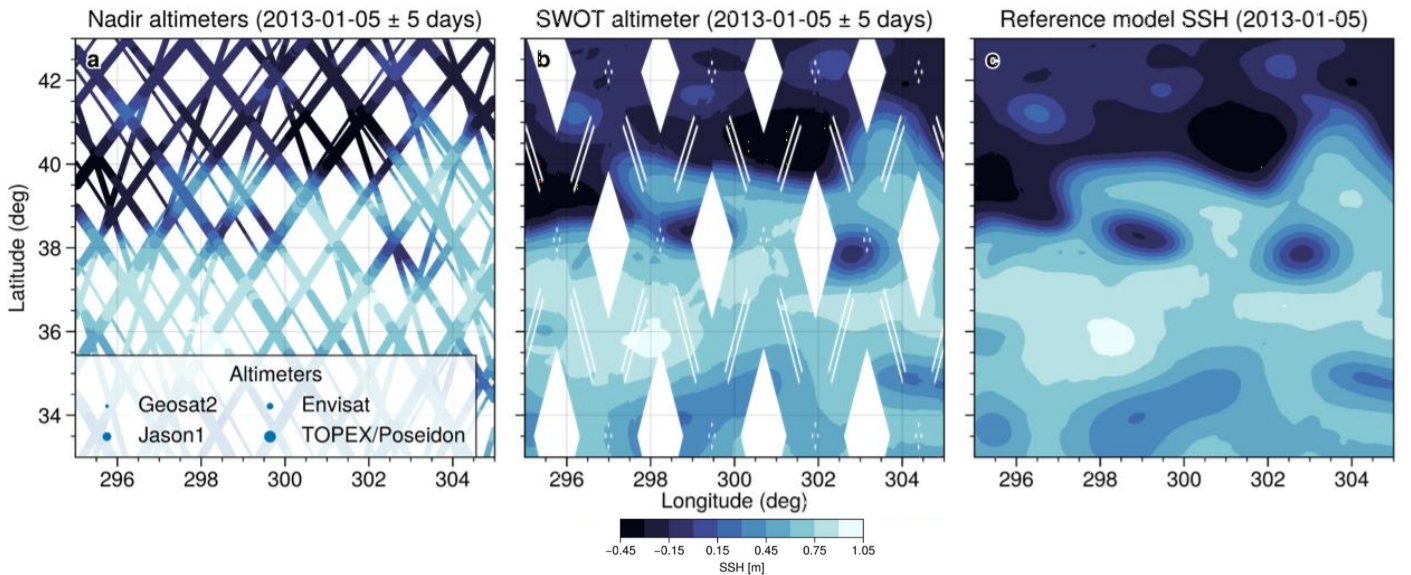
This simulated products "2020A_SSH_MAPPING_NATL60" (SWOT BOOST Data Challenge) are model-based Sea Surface Height (SSH) products and contain Sea Surface Height data simulated on 1) several along-track altimeter orbits (Jason1, Envisat, Geosat2, Topex/Poseidon interleaved and SWOT-nadir orbits - which is not currently in orbit) and 2) the large-swath of SWOT (not currently in orbit). These SSH data are interpolated onto the orbits thanks to the SWOTSimulator package from a realistic high resolution ocean simulation.
-
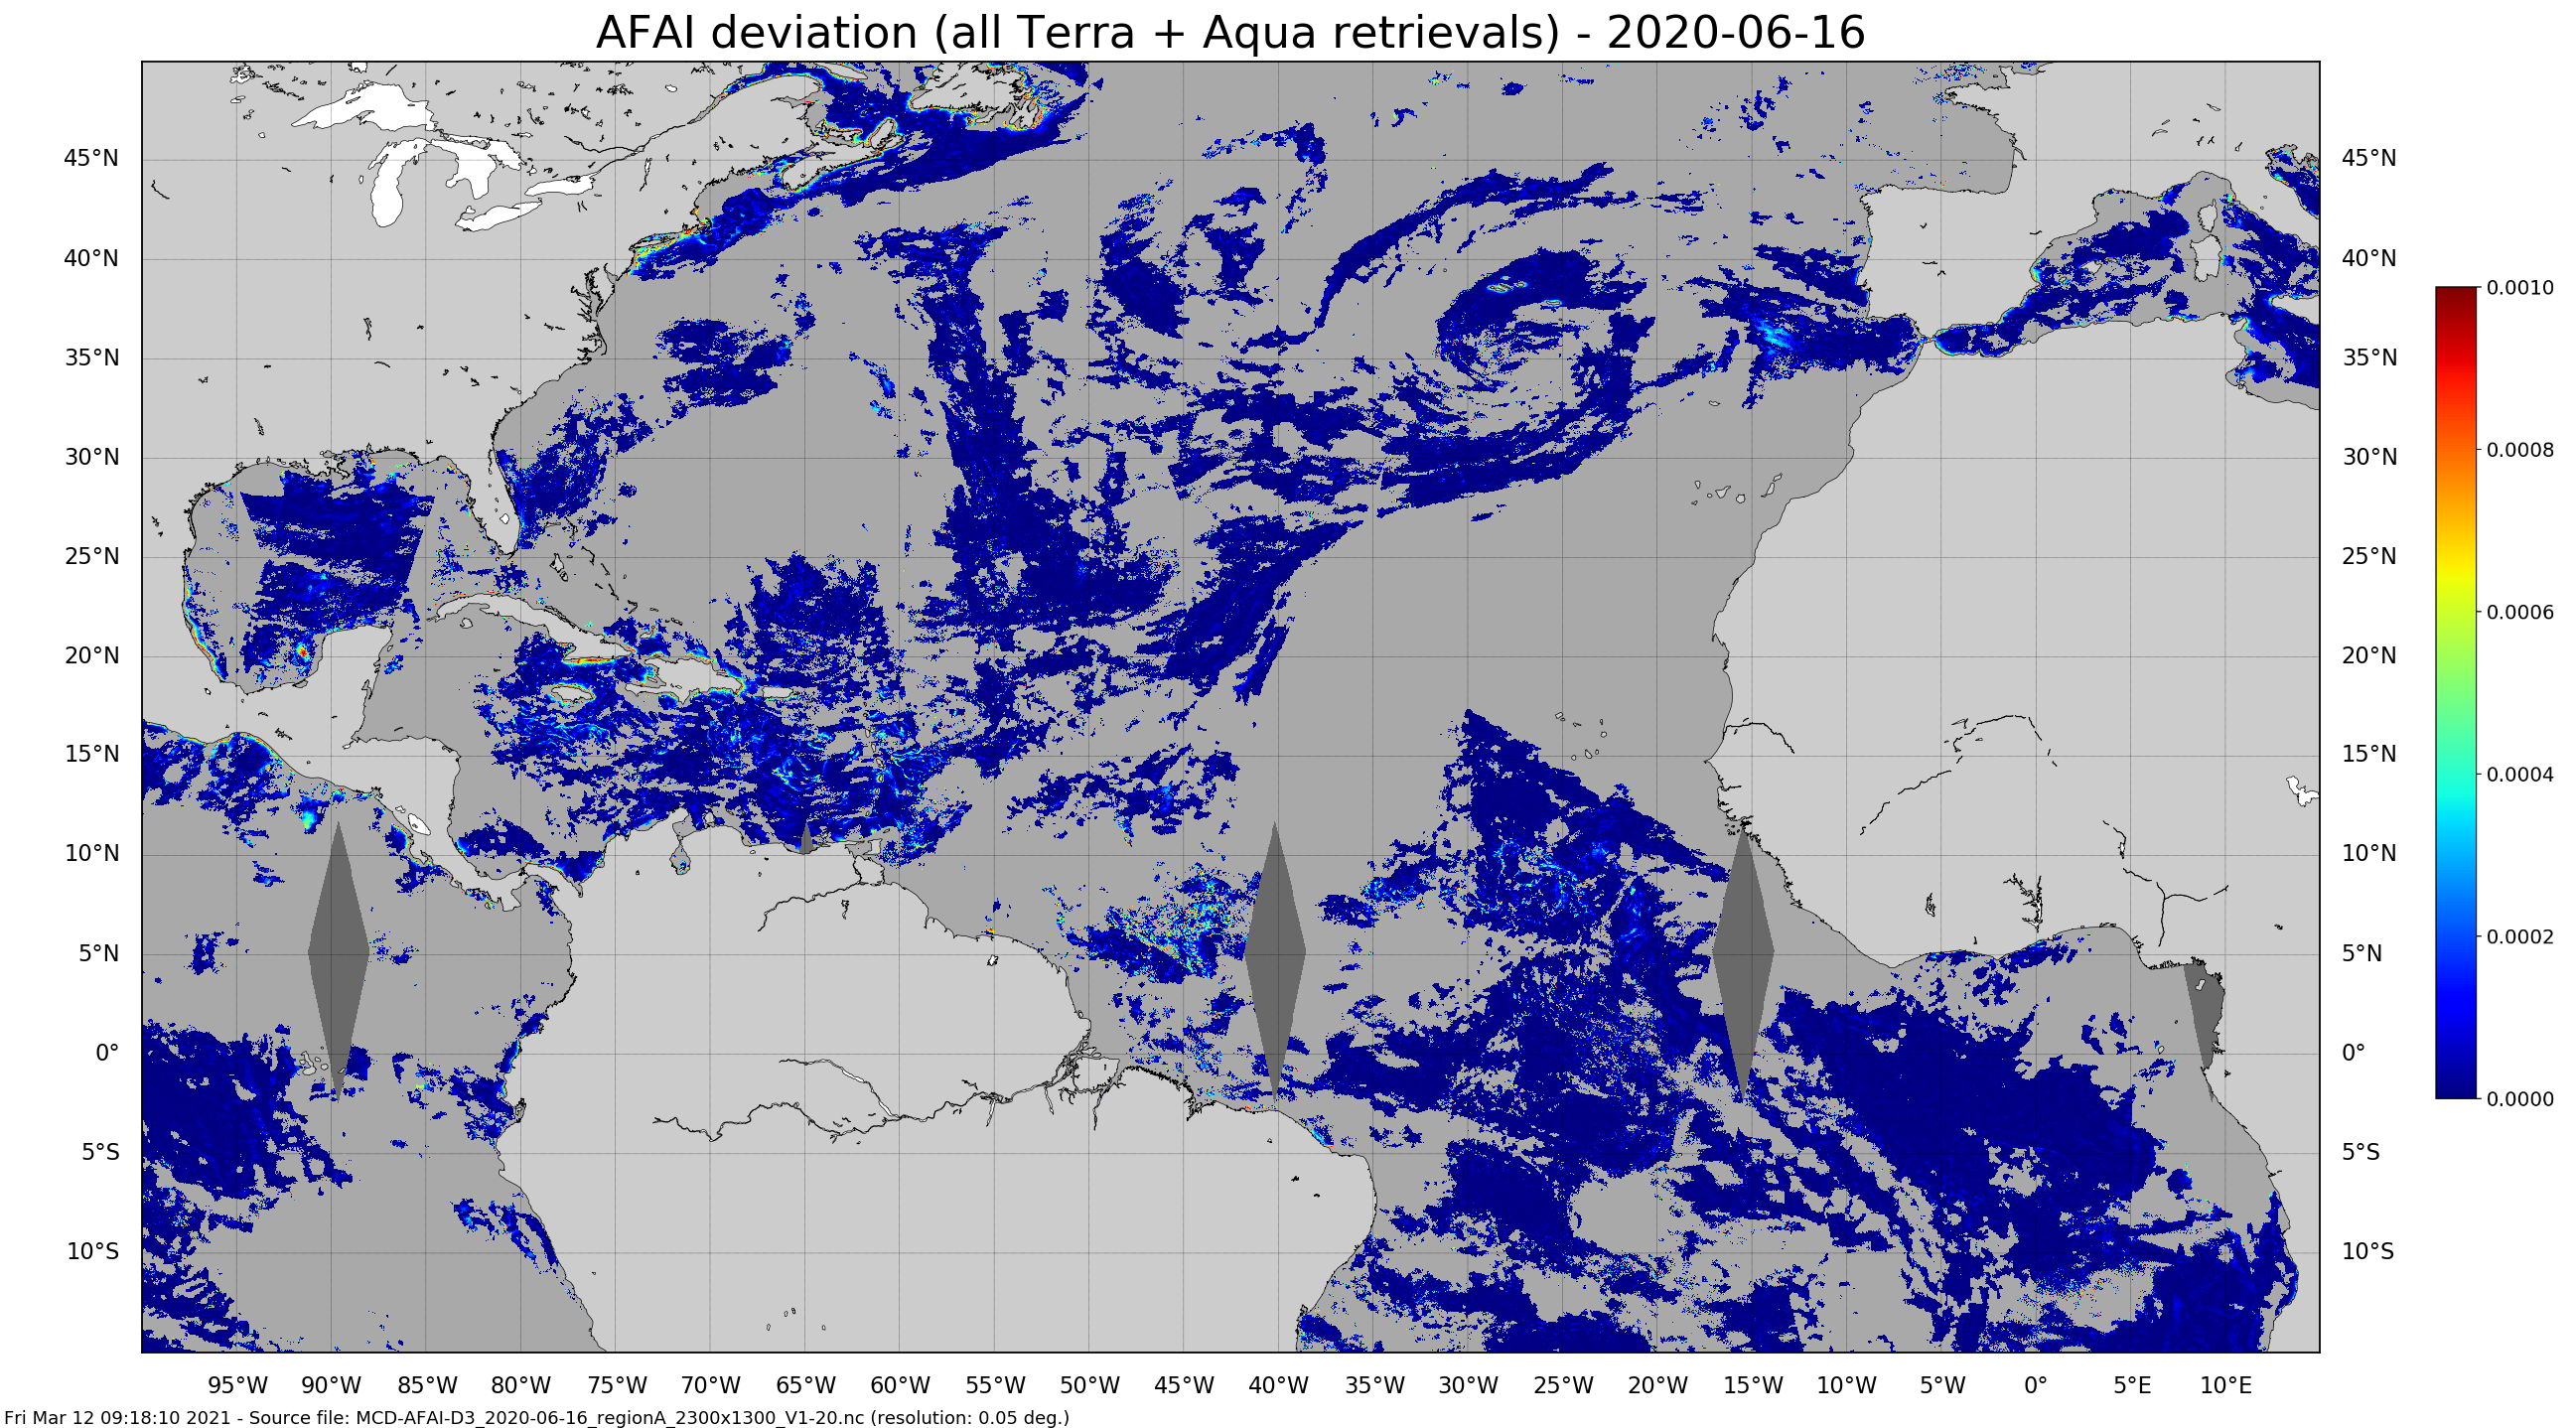
Daily gridded Sargassum area coverage derived from MODIS Terra and Aqua observations over the Atlantic, produced with the AFAI (Alternative Floating Algae Index)-based SAREDA (SArgassum Evolving Distribution in the Atlantic) algorithm.
-
-
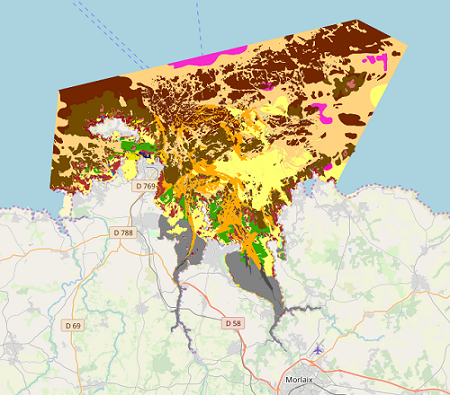
Map of benthic habitat synthesis of the Natura 2000 site FR5300015 - Bay of Morlaix is the result of the fusion and harmonization of five cartographic data. They were generated according to mapping strategies, interpretation scales and on the basis of different cartographic supports.
-
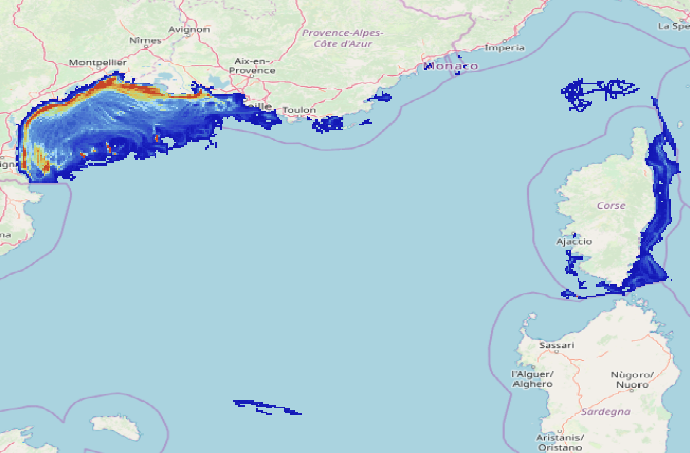
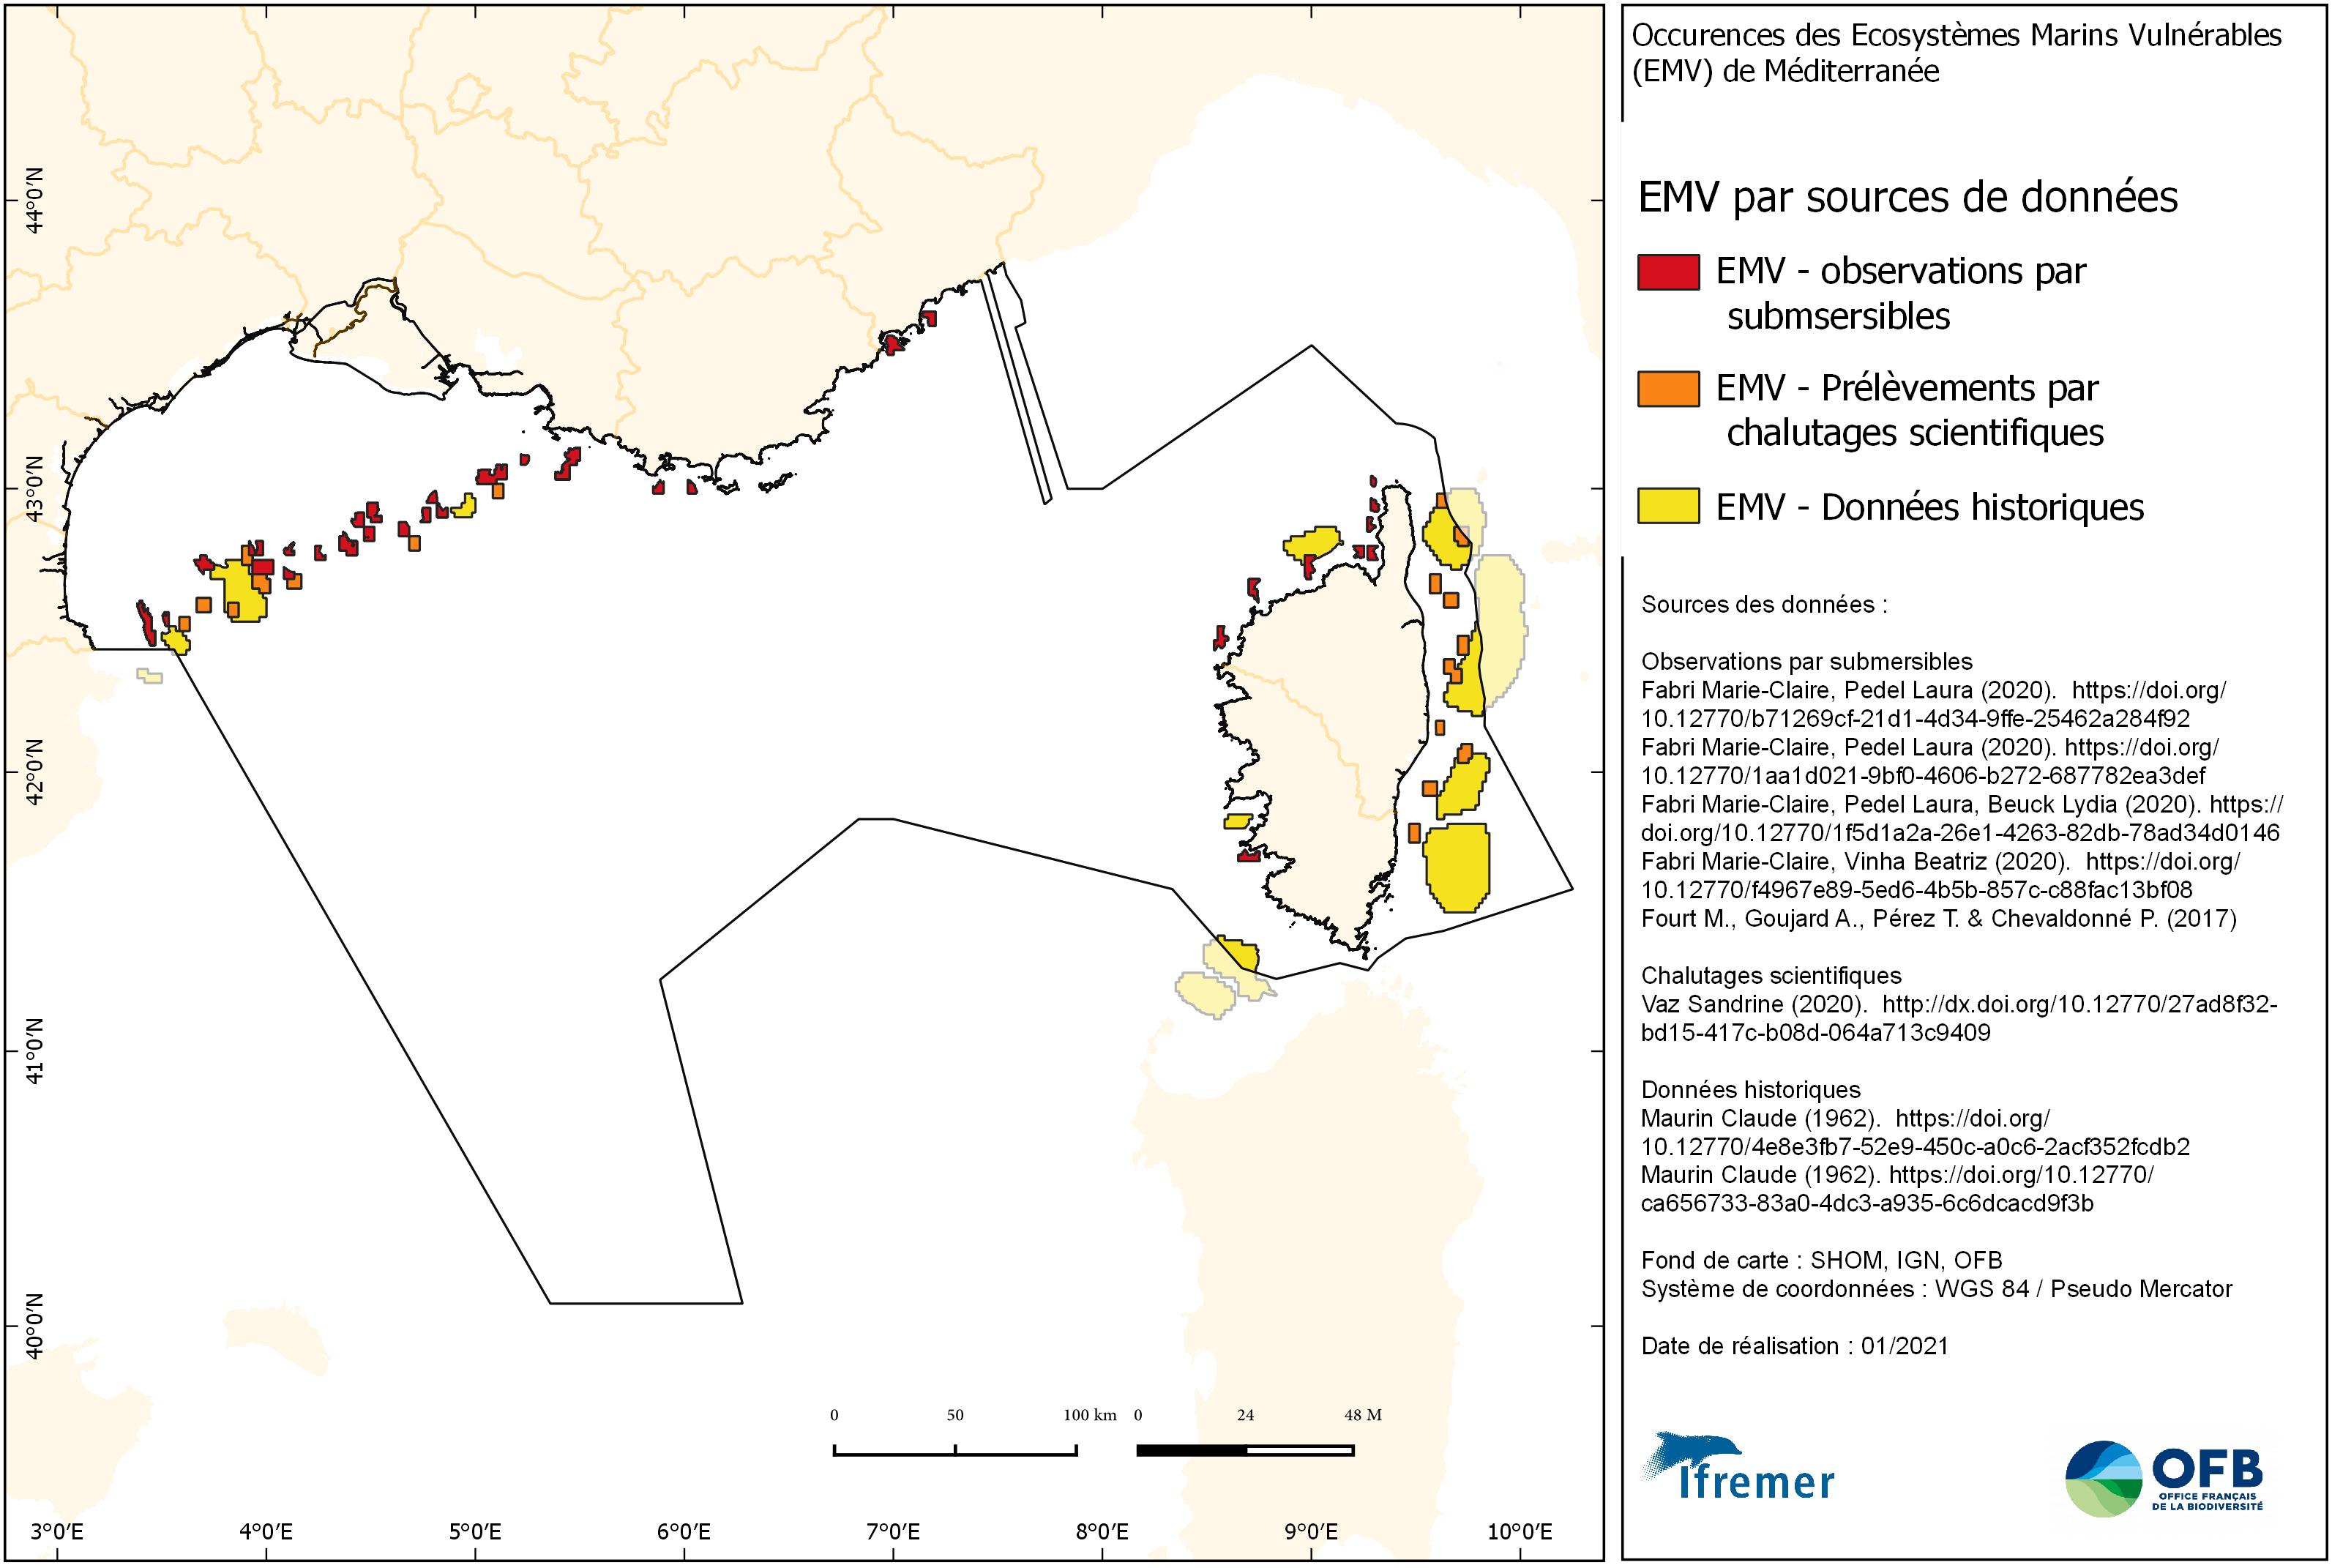
Data on physical impact intensity caused by trawling (bottom otter trawl, twin bottom otter trawl, dredges) estimated from VMS (Vessel Monitoring System) data cross-referenced with the Community Fishing Fleet Register and, for French vessels, with the landing data between 2008 and 2020. The data is constituted of 14 rasters in a resolution of 1’x1’ (13 annual abrasion rasters between 2008 and 2020 and 1 raster representing the 90th percentile of inter-annual abrasion). The abrasion is expressed in swept area ratio per year for each layer. This work enabled the study of the trawling impact on benthic communities in the Gulf of Lions and Corsica. The objective was to better describe the spatial and temporal repartition of trawling in this area and its potential impact on benthic habitats.
-
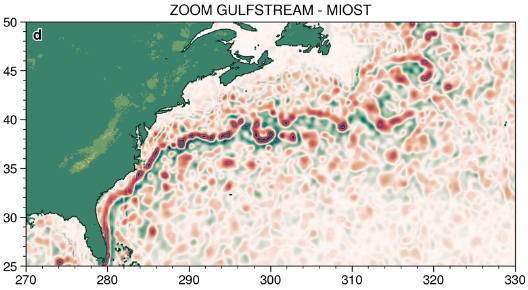
The MIOST (Multiscale Interpolation Ocean Science Topography) experimental altimeter product provides grids at delayed-time, at global scale, 1/10° spatial resolution, the sea surface height (MSLA and MADT) as well as the geostrophic currents, resulting from specific processing. Use for regional studies, ocean variability (mesoscale circulation,...).
-
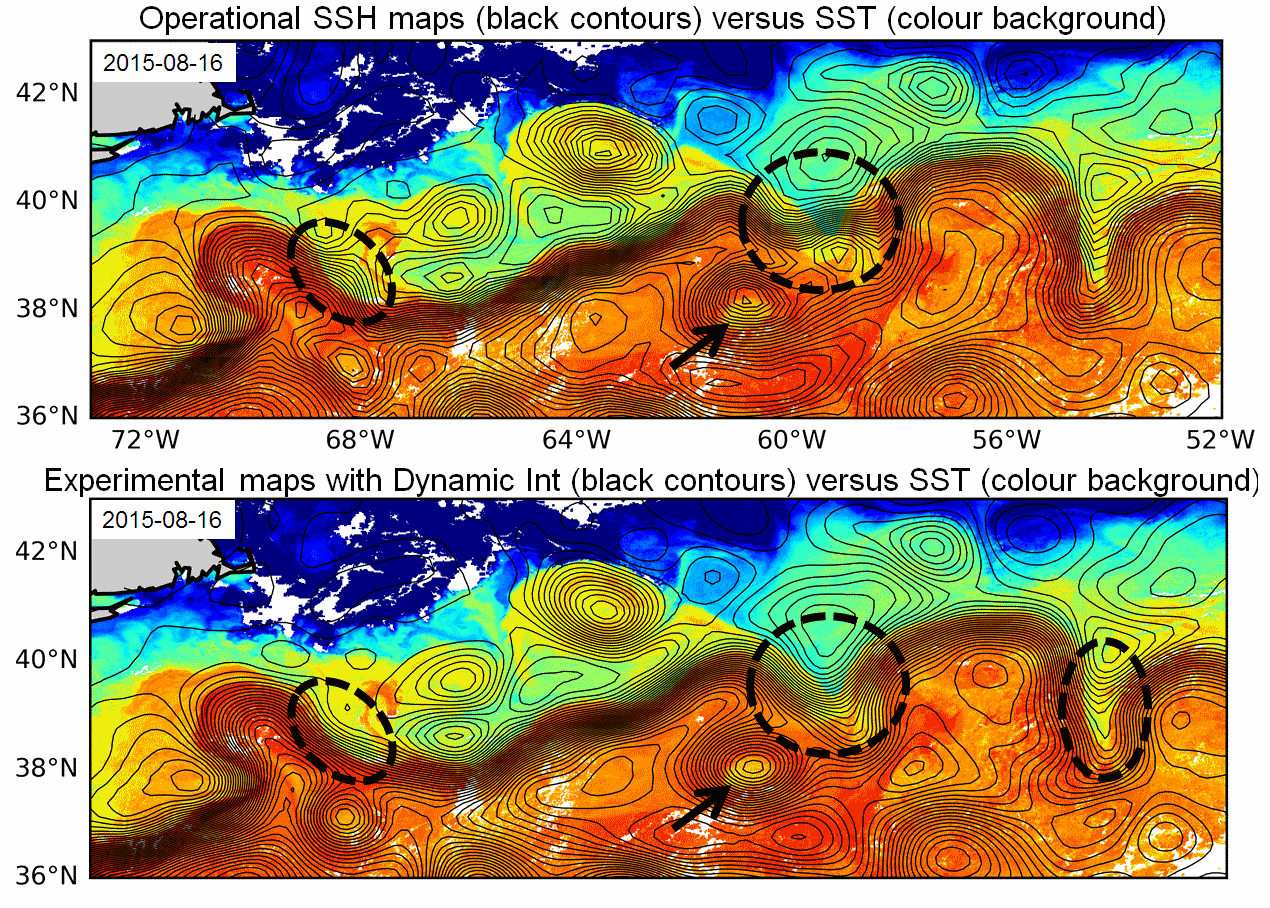
Multimission altimeter products "Experimental" with a finer resolution in preparation to the SWOT Era with sea surface heights computed with respect to a twenty-year mean and Geostrophic velocities, resulting from specific processes, available in delayed time. Use: regional studies, ocean variability (mesoscale circulation,...),