 Metadata catalogue
/Physical oceanography/Acoustics
Type of resources
Available actions
Topics
INSPIRE themes
Keywords
Contact for the resource
Provided by
Years
Formats
Representation types
Update frequencies
status
Scale
-
Quonops Online Services provide noise monitoring and prediction tools. In a similar manner to weather forecasting systems, Quonops© produces an estimate of the spatio-temporal distribution of noise levels generated by human activities at sea, aggregating multiple sources, and assessing short-, mid- and long-term source contributions to the global noise field. The outputs from Quonops© are tailored to the requirements of existing and emerging national and international regulations regarding: - Underwater noise. - The conservation of habitats and marine ecosystems. - The protection of marine species. Such tools aim to support management decisions by assessing, quantifying and prioritizing direct and indirect anthropogenic pressures on marine life, according to regulations on underwater noise, especially the descriptor 11 of the European Marine Strategy Framework Directive.
-

Water column sonar data, the acoustic back-scatter from the near-surface to the seafloor, are used to assess physical and biological characteristics of the ocean including the spatial distribution of plankton, fish, methane seeps, and underwater oil plumes. In collaboration with NOAA's National Marine Fisheries Service (NMFS) and the University of Colorado Boulder, NOAA’s National Centers for Environmental Information (NCEI) established a national archive for water column sonar data. This project entails ensuring the long-term stewardship of well-documented water column sonar data, and enabling discovery and access to researchers and the public around the world. Data providers include NOAA National Marine Fisheries Service (NMFS), NOAA Office of Ocean Exploration and Research (OER), NOAA National Ocean Service (NOS), Rolling Deck to Repository (R2R), U.S. academic and private institutions, and international groups. This data set comprises the water-column sonar data archived at NCEI in a more readily accessible media. Data provided to NCEI are in their raw format. Processing routines are being applied to a subset of the archive, specifically focusing on Simrad EK60 single and multiple frequency datasets. Ping alignment, noise removal algorithms (De Robertis & Higgenbottom, 2007; Ryan et al., 2015), and bottom detection algorithms are applied to the raw data binned into one hour intervals using Echoview (Myriax, v.10). The processed data are exported as a CSV for each interval and each frequency.
-

The Joint WMO-IOC Technical Commission for Oceanography and Marine Meteorology Observing Programmes Support Centre, provides technical coordination at international level for the sustained elements of the Global Ocean Observing System. The Centre monitors in real-time the status of the observing networks and provides a toolbox to evaluate their performance and optimize their implementation and data flow. Currently JCOMMOPS monitors the Argo profiling floats, the DBCP surface drifters, coastal and tropical moorings, ice buoys, tsunami buoys, the OceanSITES moorings time-series, the GO-SHIP hydrographic reference lines, the SOT mat/ocean ship based observations and the GLOSS sea level tide gauges. A number of other observing systems are being added gradually, including ocean gliders, polar systems, marine mammals and potentially HF radars.
-
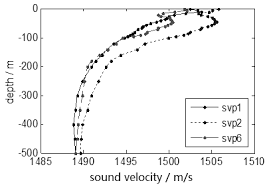
The INtegrated Mapping FOr the Sustainable Development of Ireland's MArine Resource (INFOMAR) programme is a joint venture between the Geological Survey of Ireland (GSI) and the Marine Institute (MI). The programme is the successor to the Irish National Seabed Survey (INSS) and concentrates on creating integrated mapping products related to the seabed. A sound velocity profile shows the speed of sound in water at different vertical levels. It has two general representations: 1. tabular form, with pairs of columns corresponding to ocean depth and the speed of sound at that depth, respectively. 2. a plot of the speed of sound in the ocean as a function of depth, where the vertical axis corresponds to the depth and the horizontal axis corresponds to the sound speed. By convention, the horizontal axis is placed at the top of the plot, and the vertical axis is labeled with values which increase from top to bottom, thus reproducing visually the ocean from its surface downward. A Sound Velocity Profile (SVP) is a measurement of the speed of sound in water. SVP data is collected during multi-beam surveying for calibration purposes to ground-truth the bathymetric and backscatter data collection. Data for SVP point locations and associated attribute values is generated from SVP profiler during survey. Data includes XY Longitude Latitude, Start SVP, End SVP, Maximum Depth, Data Quality and Comments, SVP Instrument Name and Survey Leg name.