 Metadata catalogue
/Physical Oceanography/Temperature
Type of resources
Available actions
Topics
INSPIRE themes
Keywords
Contact for the resource
Provided by
Formats
Representation types
Update frequencies
status
Scale
Resolution
-

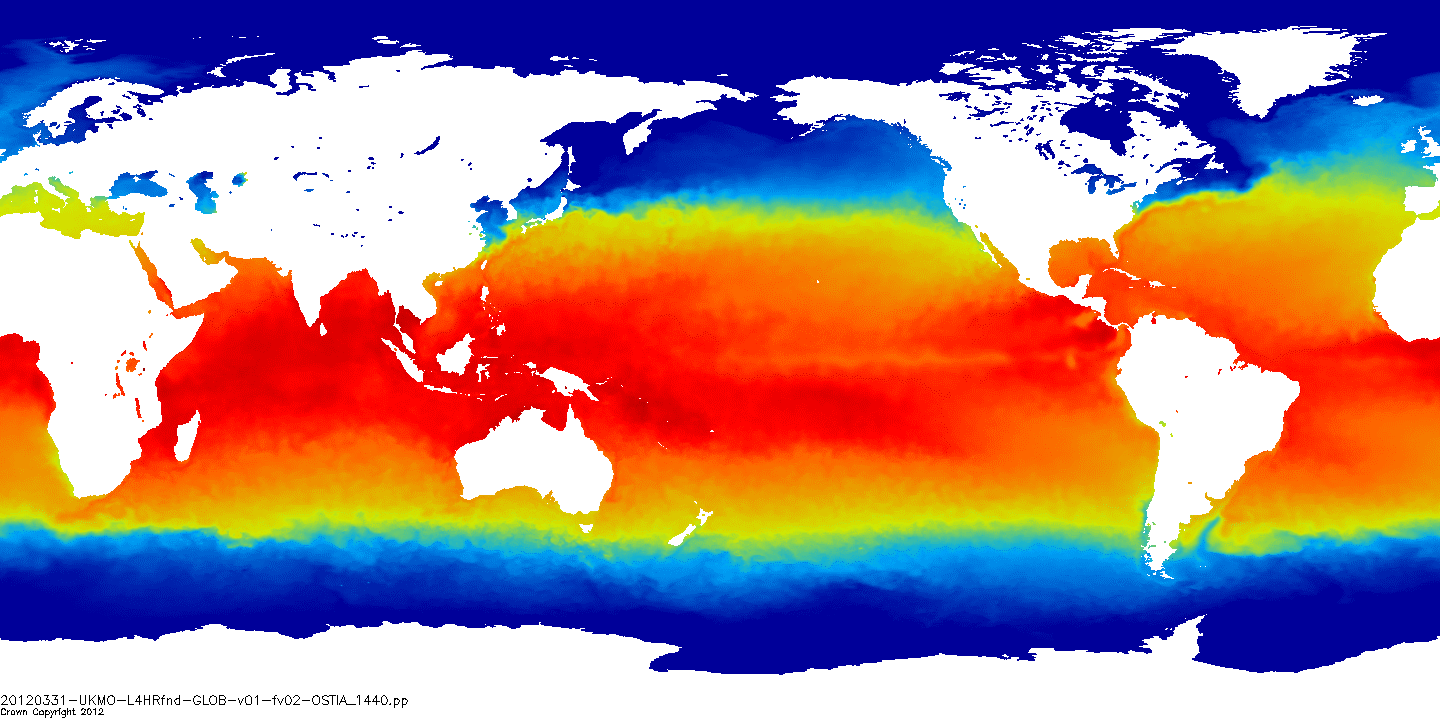
This product provides a gap free map of sea surface temperature at high resolution (UHR) on a 0.1 x 0.1 degree grid (approximately 10 x 10 km) for the Global Ocean, every 24 hours. It combines the nighttime observations of several infrared and microwave spaceborn instruments over a period of 24 hours.
-
Advanced Along-Track Scanning Radiometer multimission data have been reprocessed to provide update retrievals of Sea Surface Temperature (SST) to produce the AATSR Reprocessing for Climate (ARC) dataset.
-
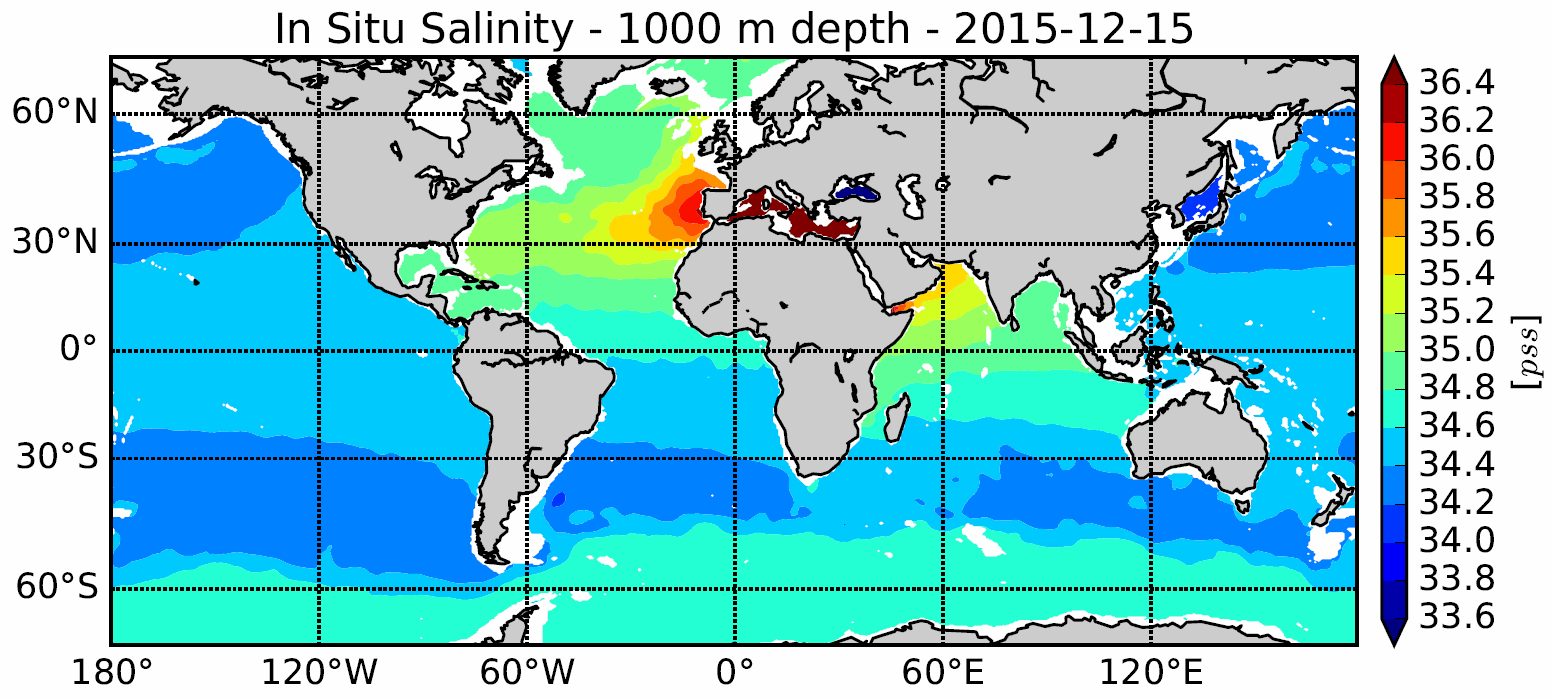
The In Situ Analysis System (ISAS) was developed to produce gridded fields of temperature and salinity that preserve as much as possible the time and space sampling capabilities of the Argo network of profiling floats. Since the first global re-analysis performed in 2009, the system has been extended to accommodate all types of vertical profile as well as time series. ISAS gridded fields are entirely based on in-situ measurements. The system aims at monitoring the time evolution of ocean properties for climatological studies and allowing easy computation of climate indices. A careful delayed mode processing of the 2002-2015 dataset has been carried out using version 7 of ISAS and updating the statistics to produce the ISAS-15 analysis.
-

This L4 SST product is produced at ultra-high resolution (UHR) on a 0.02 x 0.02 degree grid (approximately 2 x 2 km) for the Tropical Atlantic area, every 24 hours. Optimal interpolation (OI) techniques are used to combine coincident swath measures of SST from different types of sensor and to fill gaps where no observations are available. Whereas swath data essentially represent the skin or sub-skin SST, the L4 SST product is defined to represent the SST foundation (SSTfnd). SSTfnd is defined within GHRSST-PP as the temperature at the base of the diurnal thermocline. It is so named because it represents the foundation temperature on which the diurnal thermocline develops during the day. SSTfnd changes only gradually along with the upper layer of the ocean, and by definition it is independent of skin SST fluctuations due to wind- and radiation-dependent diurnal stratification or skin layer response. It is therefore updated at intervals of 24 hrs. SSTfnd corresponds to the temperature of the upper mixed layer which is the part of the ocean represented by the top-most layer of grid cells in most numerical ocean models. It is never observed directly by satellites, but it comes closest to being detected by a microwave radiometer which penetrates the skin, at dawn when the previous day's diurnal stratification can be assumed to have decayed and SSTsubskin, SSTdepth and SSTfnd are equal.
-
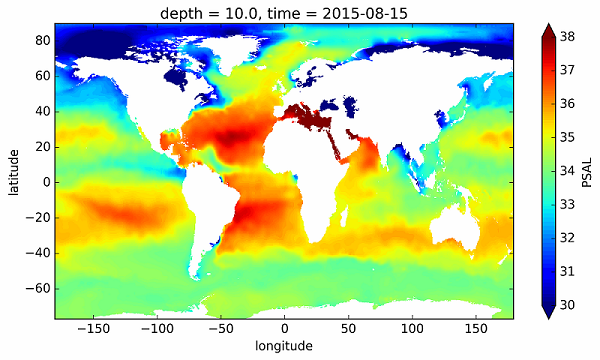
The In Situ Analysis System (ISAS) was developed to produce gridded fields of temperature and salinity that preserve as much as possible the time and space sampling capabilities of the Argo network of profiling floats. The ISAS-SSS configuration provide Sea Surface Salinity gridded fields from in-situ measurements including Argo, Moorings, Marine Mammals, GOSUD Thermosalinometer SSS measurements from delayed mode SNO-SSS merchant ships (http://www.legos.obs-mip.fr/observations/sss), French research vessels (http://doi.org/10.17882/39475) and sails (http://doi.org/10.17882/39476). A careful delayed mode processing of the 2002-2015 dataset has been carried out using version 7 of ISAS and updating the statistics to produce the ISAS-15 analysis. The ISAS-SSS fields appears as highly valuable for the "calibration and validation" of the new satellite observations delivered by SMOS, Aquarius and SMAP.
-
This compilation of Sea Surface Salinity data collected in the three tropical oceans (30°N–30°S) is derived mainly from 13 trans-oceanic Voluntary Observing Ships tracks and from 35 TAO/TRITON and 13 PIRATA mooring sites. Details about validation procedures can be found in the reference publication.
-
The annually binned Sea Surface Salinity, Temperature and Density data set covers a large part of the North Atlantic subpolar gyre. It is based on T and S near-surface data collected since December 1895 to August 2018 from all data sources, including Voluntary Observing Ships subsequently validated. This annual product presents deviations from a climatological seasonal cycle and has furthermore been smoothed in time with a 1/4, 1/2, 1/4 running-mean filter. Density time series are estimated from those annual time series, considering winter (D-J-F) climatology. Uncertainty estimates due to sampling are also provided. Data for December 2017-August 2018 are also reported as 2018, but are temporary and should not be used without further check. Long gaps have been filled by linear interpolation, and are attributed largest error.
-
The gridded Sea Surface Salinity (SSS) data set covers the region between 95°W – 20°E and 50°N – 30°S in the Atlantic Ocean. It is based on available data collected from 1970 to 2016 mostly from Voluntary Observing Ships, PIRATA moorings and Argo profilers, and subsequently validated. This monthly SSS product is gridded using an objective mapping at the spatial resolution 1° x 1°. It is distributed with its associated error fields. It is an update of the SSS product presented in Reverdin et al (2007).
-
The annually binned Sea Surface Salinity data set covers a large part of the Atlantic Ocean (75°W-10°E, 20°S-70°N). It is based on salinity near-surface data collected since December 1895 to 2016 from all data sources, including Voluntary Observing Ships subsequently validated. This annual product presents Atlantic SSS 32 grid box anomaly and error time-series (for boxes 1 to 26, year 2016 not smoothed 1-2-1), as well as Atlantic SSS grid box coordinates and March-May mean climatology. The SSS binned time series are an update from the 1896-2013 time series (Friedman et al., 2017).
-
Gridded XBT temperature sections from the SURVOSTRAL project provide a unique multi-decadal observational dataset of temperature across the Southern Ocean from Hobart (Tasmania, 42.9°S, 147.3°E) to Dumont d’Urville (Adelie Land, 66.6°S, 140.0°E), starting in 1992. Gridded temperature sections are based on XBT temperature profiles collected each year during the summer heating cycle from early spring (Oct/Nov) to autumn (Mar), over the depth range from the surface down to 900 m. XBT data were collected aboard the French supply vessel L’Astrolabe, with the support of the French Institut Polaire Emile Victor (IPEV), the LEGOS research laboratory, the CSIRO Marine and Atmospheric Research division. and the National Oceanic and Atmospheric Administration (NOAA). This XBT section is part of the SOP (Ships of Opportunity) network and CLIVAR, and is referred to as section IX28 (https://doi.org/10.18142/172 ). The dataset consists of 25 years (November 1992 to February 2017) of 10238 expendable bathythermograph (XBT) profiles on this section between Hobart, Australia and Dumont d’Urville, Antarctica. Measurements are collected from an average of six transects per year between late October and early March. Depending on ice and weather conditions, XBT measurements are sampled every 35km, with a finer 18km sampling across the energetic polar frontal region from 49°S to 54°S. Temperature profiles extend down to 900 meters depth with a vertical resolution of about 0.7 meters. The XBT temperature profile accuracy is +/-0.1°C. XBT profiles have been corrected for temperature and depth biases depending on the probe type. All corrected XBT measurements can be retrieved from the IMOS website (http://thredds.aodn.org.au/thredds/catalog/IMOS/SOOP/SOOP-XBT/DELAYED/Line_IX28_Dumont-d-Urville-Hobart/catalog.html). Individual XBT profiles are then mapped onto a regular meridional-vertical section from North to South, following the mean path of the Astrolabe’s transect, with 0.5° resolution in latitude (increasing to 0.25° in the polar frontal zone from 49-54°S), with 2m depth resolution down to 800 m depth. XBT profiles sampled further than 3° in longitude from the mean path of the Astrolabe are removed from the analysis. Different types of gridded products are available : 1) Climatological monthly mean temperature sections are calculated for each month during the austral summer ONDJFM period and averaged over 25 years (6 monthly mean temperature sections). 2) Austral summer (NDJF) mean temperature sections are constructed for each year from 1993 to 2017, allowing us to track the interannual temperature evolution (25 annual summer mean temperature sections). 3) Temperature values and anomalies measured for each profile of SURVOSTRAL program, gridded on mean path. Temperature anomaly profiles are constructed by subtracting the climatological monthly mean temperature value at each latitude and depth from each XBT profile. For detalis, see Auger et al. 2021.