/Human activities/Fisheries
Type of resources
Available actions
Topics
INSPIRE themes
Keywords
Contact for the resource
Provided by
Years
Representation types
Update frequencies
status
-

Explore global fisheries and aquaculture. Understand their status and how impacts are being managed. Learn what improvements are underway, and see what actions seafood stakeholders can take to drive sustainability. FishSource is a publicly available online resource about the status of fisheries, fish stocks, and aquaculture. FishSource compiles and summarizes publicly available scientific and technical information and presents it in an easily interpretable form. FishSource was created in 2007 by Sustainable Fisheries Partnership to provide major seafood buyers with up-to-date, impartial, and actionable information on the sustainability of fisheries and the improvements they need to make to become more sustainable. In 2018, information on aquaculture sources was added to the database to provide FishSource users with a more robust tool that covers all types of seafood production. Although the primary intended audience of FishSource is seafood businesses, other audiences - such as academics, researchers, and non-profit organizations - have also become frequent and welcomed users of FishSource. The information on FishSource is primarily developed and updated by a small team of in-house analysts, but their capacity is recognizably insufficient to maintain complete coverage of all global fisheries. As such, profiles may be incomplete or information may be out of date. The seafood industry and external contributors are invited to help fill any gaps that they consider priorities through our Rapid Assessment Program. FishSource always welcome comments on any of our profiles and encourage an open debate on the sources of information used and our interpretation of the data. Our objective is to use only publicly available sources and fully credit those sources, effectively acting as an inventory of information sources on fisheries and aquaculture.
-

The largest landings in this ecoregion are by Norway, the Russian Federation (Russia henceforth), Faroe Islands, and Iceland, mainly by pelagic fisheries. Other nations also have fisheries in the area. The number of fishing vessels is declining while the size of the remaining vessels is increasing. The annual catch in the ecoregion has varied between 700 000 tonnes to over 2 million tonnes. The pelagic fisheries, using purse seine and pelagic trawls, account for the largest catches by weight and target herring (her.27.1-24a514a), blue whiting (whb.27.1-91214), mackerel (mac.27.nea), and other pelagic species. The largest demersal fishery targets cod (cod.27.1-2), haddock (had.27.1-2), and saithe (pok.27.1-2) using bottom trawls, purse seine, Danish seine and gillnets, and to a lesser extent hook and line gear. Smaller fisheries target other gadoid species, Greenland halibut (ghl.27.1-2), and redfish. Landings of pelagic species within the ecoregion in the last decades have been variable. The demersal fisheries, dominated by cod, display less pronounced fluctuations than the pelagic fisheries. Information about discards is sparse, but the total weight of discards is considered low in both the pelagic and the demersal fisheries. Harp seals and minke whales are hunted in the region. Status summary of Norwegian Sea stocks relative to the ICES maximum sustainable yield (MSY) approach and precautionary approach (PA) is known for 50% of the 23 stocks assessed by ICES in this ecoregion. Only 22% of the stocks are fished below FMSY, accounting for nearly 13% of the total catch. 30% of the stocks have a biomass above MSY Btrigger, accounting for 86% of the total catch. Demersal stocks have shown a trend of declining fishing mortality since the mid-1990s, and the average F/FMSY ratio is now close to 1. The mean SSB/MSY Btrigger ratio of demersal stocks has been decreasing over the last decade, but mean SSB remains above MSY Btrigger. The average F/FMSY ratio for pelagic stocks has been decreasing since 2000 and is now close to 1. The mean SSB/MSY Btrigger ratio for pelagic species has shown a slight increase over the last two decades and is above 1. In addition to biomass removal, ecosystem effects of fisheries include abrasion, ghost fishing, and bycatch of protected, endangered, and threatened species.
-

Assessments run at AFWG provide the scientific basis for the management of cod, haddock, saithe, redfish, Greenland halibut and capelin in subareas 1 and 2. Taking the catch values provided by the Norwegian fisheries ministry for Norwegian catches1 and raising the total landed value to the total catches gives an approximate nominal first-hand landed value for the combined AFWG stocks of ca. 20 billion NOK or ca. 2 billion EUR (2018 estimates).
-

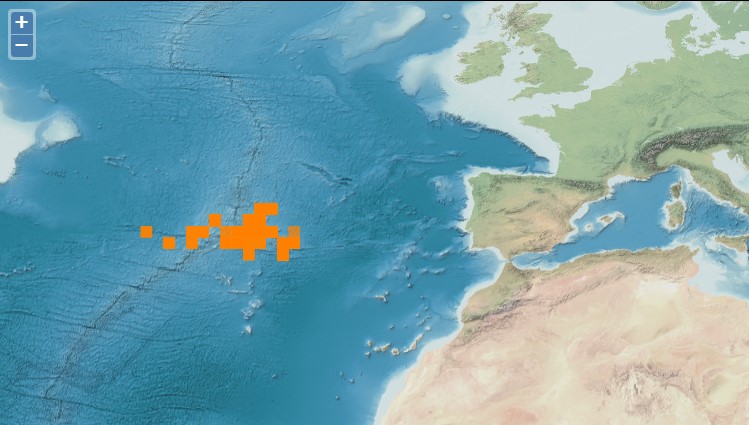
Demersal surveys performed with bottom longline during research cruises around Azorean islands and several seamounts. Surveys conducted annually (few exceptions) from 1996 to 2013. Sampling is performed using a "stone-buoy longline" similar to the one used in the commercial demersal fishery in the Azores. The sampling is stratified and random based on depth and geographic areas from 25 meters to 1200 meters mostly, but few sets down to 2000 meters. In some sets a different longline design was used (see Menezes et al. 2009). Soak time was usually 2 to 3 hours, but deeper sets (below 1000 meters) have longer soaks times. Chopped and salted sardines were used as bait.
-

-

As a consequence of the impact of the COVID pandemic on international travel which prevented the traditional meeting from taking place, the Working Group on Widely Distributed Stocks (WGWIDE) met online via WebEx hosted by ICES. Prior to the 2020 meeting, the generic ToRs for species and regional working groups were re-prioritised by ACOM to allow the WG to focus primarily on those ToRs most applicable to the provision of advice. WGWIDE reports on the status and considerations for management of Northeast Atlantic mackerel, blue whiting, Western and North Sea horse mackerel, Northeast Atlantic boarfish, Norwegian springspawning herring, striped red mullet (Subareas 6, 8 and Divisions 7.a-c, e-k and 9.a), and red gurnard (Subareas 3, 4, 5, 6, 7, and 8) stocks. Northeast Atlantic (NEA) Mackerel. This stock is highly migratory and widely distributed throughout the Northeast Atlantic with significant fisheries is most ICES subareas. A diverse range of fleets from smaller artisanal, handline vessels to large (100m+) factory freezer vessels and modern RSW trawlers and purse seiners take part in what is one of the most valuable European fisheries. The assessment conducted in 2020 is an update assessment, based on the configuration agreed during the most recent inter-benchmark exercise in 2019 and incorporates the most recent data available from sampling of the commercial catch in 2019, the final 2019 egg survey SSB estimate, an updated recruitment index and tagging time series along with 2020 survey data from the IESSNS swept area survey. Advice is given based on stock reference points which were updated during a management strategy evaluation carried out in 2020. Following a strong increase from 2007 to 2014, SSB has been declining although it remains well above MSY Btrigger. Fishing mortality has been below FMSY since 2016. There have been a number of large year classes since 2001 with above average recruitment over much of the most recent decade. Blue Whiting. This pelagic gadoid is widely distributed in the eastern part of the North Atlantic. The 2020 update assessment followed the protocol from the most recent inter-benchmark in 2016 and used preliminary catch data from 2020. Due to the cancellation of the 2020 acoustic survey, this data was not available. The effect on the assessment was minimal and limited to increases in uncertainty of the terminal year estimates. The SSB continues to decrease from the most recent maximum in 2017 mainly due to below average recruitment since 2017, although it remains above MSY Btrigger. Fishing mortality has been above FMSY since 2014. Norwegian Spring Spawning Herring. This is one of the largest herring stocks in the world. It is highly migratory, spawning along the Norwegian coast and feeding throughout much of the Norwegian Sea. The 2020 assessment is based on an implementation of the XSAM assessment model introduced at the benchmark in 2016. This years’ assessment indicates that the stock is continuing to decline from the peak in 2008 of 7Mt to just above MSY Btrigger due to successive years of average or below average recruitment. Catch advice for 2021 is given on the basis of the agreed management plan and represents a substantial increase over the 2020 advice due to an upward revision in the estimate of the 2016 year-class which is considered to be the most significant year-class since 2004.
-

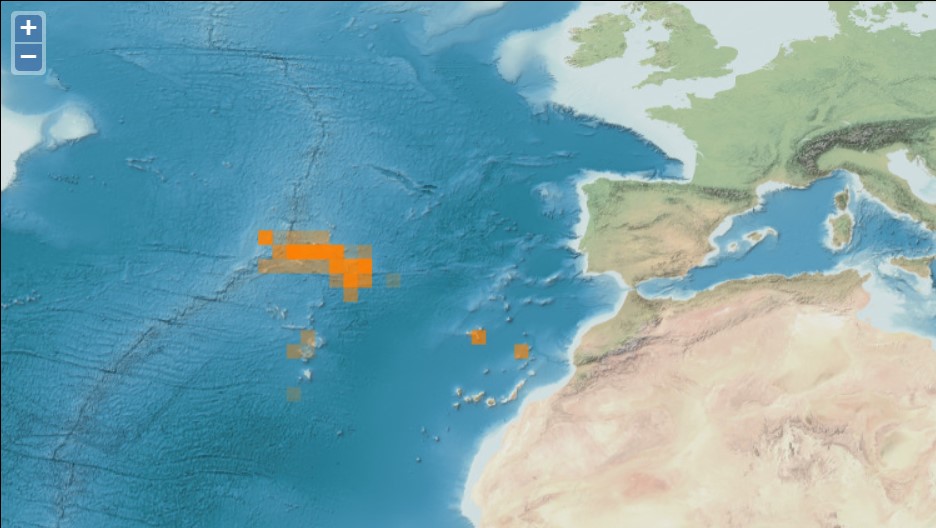
Other fish species caught during the tuna fishing operation that were commercialized. These species were caught along with the target species (tuna) by using pole and line. POPA was launched in 1998 with the main goal of certifying the tuna caught around the Azores as a "dolphin safe product". This label is attributed by the non-governmental organization Earth Island Institute to catches made without mortality of cetaceans. POPA has built an extensive database with information collected by the observers on board the tuna fishing vessels. This database includes information on tuna fisheries (e.g., location of fishing events, catches, and fishing effort), weather conditions (e.g., sea surface temperature, wind and visibility), live bait fisheries (e.g., location of fishing events, catches, gears used), cetaceans (e.g., occurrences, interaction with fishing events and association with other species), birds and sea turtles (e.g., occurrences). POPA is also responsible for "Friend of the Sea" tuna fishery certification. In the late 1990’s, it became clear that the tuna industry would be seriously penalized with the absence of a "dolphin safe" certification which instigated new measures from the government and the fisheries sector. In order to achieve this certification, the Azores Fisheries Observer Programme (POPA) was funded in 1998, ensuring the absence of dolphin mortality or injury in tuna fishery. Since then, fishery and fishing products are certified by the Earth Island Institute, through the results presented by POPA. Besides that, the tuna fishery is also certified as "Friend of the Sea" which means that it is extremely selective, doesn’t harm the surrounding environment and is quite sustainable. It became the first tuna fishery in the world achieving that certification. The Programme results from an agreement among Regional Administration, Earth Island Institute, the Tuna Canning Industry Association (Pão do Mar), the Fishing Boat Owners Association (APASA) and IMAR - Instituto do Mar - through the University of The Azores Center (IMAR-DOP/Uaç), which carries out the programme. Until 2003, the Programme was supported by regional funds. Between 2003 and 2005 it became co-financed by the European Commission through the INTERREG IIIb Programme/ ORPAM project. Since then it has been exclusively supported by the regional government through the Regional Secretary of Fisheries.
-

The Sea Around Us is a research initiative at The University of British Columbia (located at the Institute for the Oceans and Fisheries, formerly Fisheries Centre) that assesses the impact of fisheries on the marine ecosystems of the world, and offers mitigating solutions to a range of stakeholders. The Sea Around Us was initiated in collaboration with The Pew Charitable Trusts in 1999, and in 2014, the Sea Around Us also began a collaboration with The Paul G. Allen Family Foundation to provide African and Asian countries with more accurate and comprehensive fisheries data. It provides data and analyses through View Data, articles in peer-reviewed journals, and other media (News). We regularly update our products at the scale of countries’ Exclusive Economic Zones, Large Marine Ecosystems, the High Seas and other spatial scales, and as global maps and summaries. It emphasises catch time series starting in 1950, and related series (e.g., landed value and catch by flag state, fishing sector and catch type), and fisheries-related information on every maritime country (e.g., government subsidies, marine biodiversity). Information is also offered on sub-projects, e.g., the historic expansion of fisheries, the performance of Regional Fisheries Management Organizations, or the likely impact of climate change on fisheries. The information and data presented on this website is freely available to any user, granted that its source is acknowledged. We are aware that this information may be incomplete. Please let us know about this via the feedback options available on this website.
-

This is a portion of the data used to calculate 2008 and 2013 cumulative human impacts in: Halpern et al. 2015. Spatial and temporal changes in cumulative human impacts on the world's ocean. Seven data packages are available for this project: (1) supplementary data (habitat data and other files); (2) raw stressor data (2008 and 2013); (3) stressor data rescaled by one time period (2008 and 2013, scaled from 0-1); (4) stressor data rescaled by two time periods (2008 and 2013, scaled from 0-1); (5) pressure and cumulative impacts data (2013, all pressures); (6) pressure and cumulative impacts data (2008 and 2013, subset of pressures updated for both time periods); (7) change in pressures and cumulative impact (2008 to 2013). All raster files are .tif format and coordinate reference system is mollweide wgs84. Here is an overview of the calculations: Raw stressor data -> rescaled stressor data (values between 0-1) -> pressure data (stressor data after adjusting for habitat/pressure vulnerability) -> cumulative impact (sum of pressure data) -> difference between 2008 and 2013 pressure and cumulative impact data. This data package includes 2008 and 2013 raw stressor data. The 2008 data includes 18 raster files (preceeded by raw_2008_). The 2013 data includes 19 raster files (preceeded by raw_2013_). There is no sea level rise data for 2008.
-
The dataset includes age- and length-based catch per unit effort data for commercial fish species collected by the French trawl survey EVHOE.
 Metadata catalogue